{
"fetched_at": "2026-10-18T13:55:12Z",
"source_url": "https://www.kaggle.com/competitions/ag-ml-leipzig-2025-future-crop/data",
"pages": [
{
"name": "data-description",
"content": "Input data is provided in the form of two-dimensional files such that each row corresponds to a unique combination of latitude, longitude, year and crop. We provide separate files for each climate variable (precipitation, shortwave radiation, minimum and maximum daily temperature and mean daily temperature), which contain 240 columns reflecting daily values for 30 days before sowing and 210 days after. An additional file contains the dominant USDA soil texture class (constant over time), the ambient CO2 concentration (spatially constant), the planting date and the nitrogen application rate (constant over time). Each input datapoint therefore consists of a multivariate time series of shape 5x240, plus several auxiliary variables. The target variable is a single value (end-of-season crop yield in tons per hectare) per unique gridcell, year and crop combination.\n\nAll the data is in .parquet format, and the predictive features have been split across several files due to their size to make it easier to work with. Each row corresponds to a unique datapoint (one growing season at one 0.5 degree grid cell), with columns corresponding to different variables, and the column ID as a unique identifier.\n\nThe training set consists of the first 39 years, covering 1982 to 2020; this can be used for training your models. The resulting yields are provided in the files `train_solutions_maize.parquet` and `train_solutions_wheat.parquet`.\n\nThe test set is twice as big as the training set, covering the 78 years from 2021 to 2098. The first 30 of those years (2021-2050) will be used to measure your models' performance (using RMSE as scoring metric) on the public leaderboard during the challenge, and model performance on the rest of the years will be revealed after the challenge ends.\n\n## Files\n\n* Training data (1982-2020)\n - For each crop (maize and wheat)\n - Five files containing climate variables from 30 days before and 210 days after planting date\n + rsds - daily short-wave radiation\n + pr - daily precipitation\n + tas - daily mean temperature\n + tmax - daily maximum temperature\n + tmin - daily minimum temperature\n - One “solutions” file containing the target variable (yield)\n - Soil\n - One file containing soil texture, real year, nitrogen fertilization rate and CO2 concentration\n* Test data (2021-2098)\n - For each crop (maize and wheat)\n - Five files containing climate variables from 30 days before and 210 days after planting date\n + rsds - daily short-wave radiation\n + pr - daily precipitation\n + tas - daily mean temperature\n + tmax - daily maximum temperature\n + tmin - daily minimum temperature\n - Soil\n - One file containing soil texture, real year, nitrogen fertilization rate and CO2 concentration\n* sample_submission.csv - an example of how your submitted predictions file should look.\n\n**Important note:** To make it easier for participants to work with, we have split most of the data files between the two crops (maize and wheat). However, submission files should include predictions for **both** crops.\n\n## Columns\n\nAll files contain an `ID` column, which is a unique ID for each datapoint (crop, gridcell and year). Apart from **train_crop_solutions.csv**, all other files also contain columns `lat`, `lon`, `year` and `crop`. Note that `year` is **not** the 'real year' but reflects the number of growing seasons since the start of the simulation run. However, the 'real year' can be found in the **soil_co2_*.parquet** files in the column `real_year`. In these files, `texture_class` contains the dominant USDA soil texture class (categorical variable coded as 1 to 13) and `co2` contains the ambient CO2 concentration in parts per million. Finally, `nitrogen` describes the annual fertilization rate in tons per hectare per growing season.\n\nAdditional units: short-wave radiation [W m-2], precipitation [kg m-2 s-1], temperatures [o C], yield [t ha-1]].\n\nBecause the dataset is very large, each climate variable is in a separate file to make it easier to work with - you might not want to use all of the variables at first. Each file contains 240 columns reflecting one daily value, from 30 days before sowing until 210 days after, as well as a column called `variable` with the name of the variable being measured (e.g. pr, tas or rsds), and columns describing the year, latitude, longitude and crop, as well as the unique `ID` to facilitate joining the datasets.",
"isPublished": false,
"hasIsPublished": false,
"postTitle": "",
"hasPostTitle": false,
"mimeType": "",
"hasMimeType": false
},
{
"name": "Description",
"content": "**You are going to predict the yield of wheat and maize under climate change conditions.** Projected mean growing-season radiation and temperature are increasing each decade, and precipitation patterns are changing. The CO2 level is also rising, which can have a fertilisation effect on yields - but the effect of this depends on the crop’s photosynthesis pathway, which is different for maize and wheat.\n\nIn reality, irrigation and fertilisation would also vary over time, adding complication. However, in these simulations, this doesn’t need to be considered. We work only with water-limited yields, which means all grid cells are rainfed, and crops are fertilised at the same rate for all years, varying by country.\n\nWe have restricted the grid cells to areas which are heavily harvested (at least 2000 hectares), and we are providing 30 days of climate data before sowing at each grid cell and 210 days after to use as predictive features. The growing season will not necessarily last exactly 210 days. Crops are harvested when they reach maturity, but the maturity process is influenced by the effects of the weather, fertilization, CO2 level and soil type.\n\nWe included below a few visualisations of the behaviour of the climate variables, so that these variabilities and distribution shifts become more clear.\n\n\n\n\n\n\n\n\n\nWe include some maps of the management forcing data (nitrogen fertilization rate and soil texture). These vary spatially, based on recent observation datasets, and are held constant over time for these simulations.\n\n\n\n\n\n\n\nFinally, we are only using for training and testing pixels where >2000 hectares are harvested (as of the year 2000). To illustrate this, we provide an example map of these pixels, coloured according to the yields in the second year of the training set for each crop.\n\n\n\n",
"isPublished": false,
"hasIsPublished": false,
"postTitle": "",
"hasPostTitle": false,
"mimeType": "",
"hasMimeType": false
},
{
"name": "Evaluation",
"content": "Since we can't measure the actual values of crop yields in the future, we are using simulations obtained by a crop model that has been thoroughly studied and validated. This model was used to generate the yields of the training and test data, driven by the climate data that we have provided for you as predictor data.\n\n## Metrics and leaderboards\n\nSubmissions are evaluated using the root mean squared error (RMSE) between the predicted yield and the true simulated yield from the crop model over all datapoints (unique combinations of grid cell, year and crop). A RMSE of 0 would mean a perfect emulator of the crop model.\n\nDuring the competition, the RMSE as calculated on the validation set (years 2021-2050) will be used for the Kaggle leaderboard. On November 10th, the challenge will close and model scores on the final decades (2051 - 2100) will be shown.",
"isPublished": false,
"hasIsPublished": false,
"postTitle": "",
"hasPostTitle": false,
"mimeType": "",
"hasMimeType": false
},
{
"name": "rules",
"content": "Participation in this competition can be either as an individual or as part of a team (with up to five members). Participants may not enter using multiple accounts, aliases or be a member of more than one team.\n\n• Notebook/code submission via Kaggle is required for inclusion on the leaderboards.\n• Only data provided can be used for model training (no external datasets allowed).\n• Participants must not have access to the ground truth data before the end of the contest. If the organisers deem, from inspecting submitted code, that entries rely on hard-coded elements that may have been derived from access to the ground truth, these entries will be invalidated at the organising team’s discretion.\n• Solutions should be based on open-source tools and packages.\n• Pretrained models can be used, as long as they are publicly accessible.\n• 50 submissions are permitted per 24-hour period per individual or team.\n• The organisers reserve the right to analyse the code and predictions submitted by participants for scientific purposes.\n• Participants may enter anonymously, but if selected (and willing) to contribute as a co-author to any subsequent publication, must reveal their identity.\n• A maximum of five submissions can be selected by participants or teams of participants for the final leaderboard rankings.\n\nGood luck!\n\n",
"isPublished": false,
"hasIsPublished": false,
"postTitle": "",
"hasPostTitle": false,
"mimeType": "",
"hasMimeType": false
},
{
"name": "abstract",
"content": "**Can we learn from the recent past to predict climate impacts in the future?**\n\nMachine learning models are frequently trained on observed data from the last decades and then used to make projections of future climate change impacts. However, the ability of such models to generalise to these unseen conditions outside of the observed distribution is not guaranteed. How far into the future can we make good predictions? Which types of models or training methods do better or worse? Can domain generalisation strategies help, and if so, how much? We have created a benchmark dataset to help answer these questions, using simulated agricultural maize and wheat yields from biophysical crop models.\n\n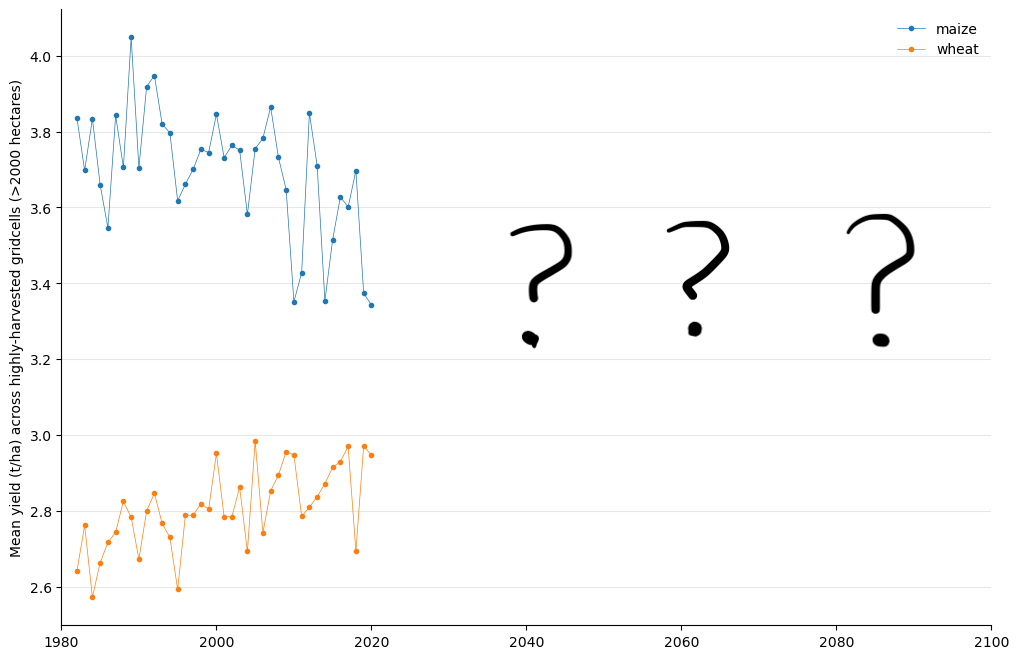\n\nYour mission is to predict end-of-season wheat and maize yields for each grid cell and year, using the daily weather experienced during the growing season (and just before), along with the soil texture and ambient CO2 level. The challenge is that you must predict yields in the future - from 2021 to 2100 - under a high-emissions climate change scenario, but will only receive training data from the last few decades (1980 - 2020).",
"isPublished": false,
"hasIsPublished": false,
"postTitle": "",
"hasPostTitle": false,
"mimeType": "",
"hasMimeType": false
},
{
"name": "Submission File",
"content": "For each ID in the test set (which represents a unique combination of crop, gridcell and year), you must predict a yield. An example file is available to download from the Data section. The file should contain a header and have the following format:\n\n ID,yield\n 2,0\n 5,0\n 6,0\n etc.",
"isPublished": false,
"hasIsPublished": false,
"postTitle": "",
"hasPostTitle": false,
"mimeType": "",
"hasMimeType": false
},
{
"name": "Who are we?",
"content": "We are members of the Agricultural Model Intercomparison and Improvement Project (AgMIP) Machine Learning team ([AgML](https://www.agml.org/)), which brings together crop modellers, machine learning experts and other relevant scientists and stakeholders to conduct intercomparison studies and create essential resources such as benchmark datasets. [Join our mailing list](https://mail.agml.org/mailman/listinfo/agml) to stay up-to-date on this and our other activities!",
"isPublished": false,
"hasIsPublished": false,
"postTitle": "",
"hasPostTitle": false,
"mimeType": "",
"hasMimeType": false
}
]
}