
Root Mean Squared Error (RMSE) and Root Mean Squared Logarithmic Error (RMSLE) both are the techniques to find out the difference between the values predicted by your machine learning model and the actual values.
\n\nTo understand these concepts and their differences, it is important to know what does Mean Squared Error (MSE) mean. MSE incorporates both the variance and the bias of the predictor. RMSE is the square root of MSE. In case of unbiased estimator, RMSE is just the square root of variance, which is actually Standard Deviation.
\n\nIn case of RMSLE, you take the log of the predictions and actual values. So basically, what changes is the variance that you are measuring. I believe RMSLE is usually used when you don't want to penalize huge differences in the predicted and the actual values when both predicted and true values are huge numbers.
\n\nThe Robustness of RMSLE to the outliers, the property of calculating the relative error between the Predicted and Actual Values, the most unique property of the RMLSE that it penalizes the underestimation of the actual value more severely than it does for the Overestimation.
\n\n
Function\nA function to calculate Root Mean Squared Logarithmic Error (RMSLE)\nfrom: https://www.kaggle.com/marknagelberg/rmsle-function\n```\nimport math
\n\ndef rmsle(y, y_pred):
\n assert len(y) == len(y_pred)\n terms_to_sum = [(math.log(y_pred[i] + 1) - math.log(y[i] + 1)) ** 2.0 for i,pred in enumerate(y_pred)]\n return (sum(terms_to_sum) * (1.0/len(y))) ** 0.5\n```
Using sklearn
\n\n\nfrom sklearn.metrics import mean_squared_log_error\nnp.sqrt(mean_squared_log_error( y_test, predictions ))\n
RMSLE, especially the plus one version of it, is easily my least favorite metric on Kaggle. It's a kludge metric that you use when you don't know how to deal with skewed non-negative response variables. One problem with that metric is that it penalizes the models that actually give you an unbiased estimate of the target.
", "rawMarkdown": "RMSLE, especially the plus one version of it, is easily my least favorite metric on Kaggle. It's a kludge metric that you use when you don't know how to deal with skewed non-negative response variables. One problem with that metric is that it penalizes the models that actually give you an unbiased estimate of the target.", "votes": 15, "replies": [ { "id": 655035, "postDate": "2019-10-22T16:12:16.903Z", "content": "This problem it's like a 'forecasting time series models', RMSE may be better than RMSLE\nand so good measure of errors that can serve as a loss functions to minimize.\nWhat do you thing about ?
\n\nRMSE: It is symmetric and quadratic, which is suitable for Gaussian noises.\nMore generally, minimizing RMSE finds an approximation for the conditional expected value of the next observation (to be predicted) given the explanatory variables (the past in time series).
\n\n", "rawMarkdown": "This problem it's like a 'forecasting time series models', RMSE may be better than RMSLE\nand so good measure of errors that can serve as a loss functions to minimize.\nWhat do you thing about ?\n\nRMSE: It is symmetric and quadratic, which is suitable for Gaussian noises.\nMore generally, minimizing RMSE finds an approximation for the conditional expected value of the next observation (to be predicted) given the explanatory variables (the past in time series).\n\nSee this: https://www.quora.com/Why-we-use-Root-mean-square-error-RMSE-Mean-absolute-and-mean-absolute-percent-errors-for-forecasting-time-series-models" }, { "id": 655064, "postDate": "2019-10-22T16:48:48.720Z", "content": "RMSE is not a good metric either for skewed distributions, because the noise is unlikely to be Gaussian with constant variance. If you use RMSE on a skewed response variable, your fit statistic is going to be mainly driven by the observations of the highest magnitude.
\n\nWe have this problem all the time in insurance applications. Consider a typical model to predict auto insurance lost cost: the mean may be something like $500, the vast majority of observations would be $0, but some could go into $100,000 area or higher. We don't model log1p(auto insurance losses), as that would result in a model that's distorted in all kinds of ways. We typically use a Tweedie distribution to fit the GLM model, and a Gini index to evaluate it.
Gini index is a non-parametric measure, and the advantage of it is that it is agnostic to what you assume about the distribution of your target variable. Most of the other metrics, including RMSE, RMSLE, RMSL1pE, MAE, MAPE, etc., are not. When you have a non-negative response variable, you can never go wrong with a Gini index, but you can easily railroad your models to go off into stupid directions if you make a wrong choice of a distance-based metric. RMSL1pE in particular is a wrong choice for applications where you want your model to make sense and be useful.
", "rawMarkdown": "RMSE is not a good metric either for skewed distributions, because the noise is unlikely to be Gaussian with constant variance. If you use RMSE on a skewed response variable, your fit statistic is going to be mainly driven by the observations of the highest magnitude. \n\nWe have this problem all the time in insurance applications. Consider a typical model to predict auto insurance lost cost: the mean may be something like $500, the vast majority of observations would be $0, but some could go into $100,000 area or higher. We don't model `log1p(auto insurance losses)`, as that would result in a model that's distorted in all kinds of ways. We typically use a Tweedie distribution to fit the GLM model, and a Gini index to evaluate it. \n\nGini index is a non-parametric measure, and the advantage of it is that it is agnostic to what you assume about the distribution of your target variable. Most of the other metrics, including RMSE, RMSLE, RMSL1pE, MAE, MAPE, etc., are not. When you have a non-negative response variable, you can never go wrong with a Gini index, but you can easily railroad your models to go off into stupid directions if you make a wrong choice of a distance-based metric. RMSL1pE in particular is a wrong choice for applications where you want your model to make sense and be useful.", "votes": 18 }, { "id": 655091, "postDate": "2019-10-22T17:17:44.440Z", "content": "Thanks for helpful response sir !✔️
", "rawMarkdown": "Thanks for helpful response sir !✔️ " }, { "id": 658153, "postDate": "2019-10-25T18:00:52.340Z", "content": "Thank you for the explanation @dmitriyguller! I've learned a lot from it!
", "rawMarkdown": "Thank you for the explanation @dmitriyguller! I've learned a lot from it!", "votes": 1 }, { "id": 663022, "postDate": "2019-11-01T10:55:30.850Z", "content": "We typically use a Tweedie distribution to fit the GLM model, and a Gini index to evaluate it.
@dmitriyguller, thanks for your insights. Is Gini index the same as the Normalized Gini Coefficient?
", "rawMarkdown": "`We typically use a Tweedie distribution to fit the GLM model, and a Gini index to evaluate it.`\n\n@dmitriyguller, thanks for your insights. Is Gini index the same as the Normalized Gini Coefficient?" }, { "id": 663076, "postDate": "2019-11-01T12:23:00.653Z", "content": "Yes, that's the same thing.
", "rawMarkdown": "Yes, that's the same thing.", "votes": 1 }, { "id": 762478, "postDate": "2020-03-03T14:47:48.323Z", "content": "@dmitriyguller , thanks for sharing your insight. While its intuitive that RMSE will optimise for large valued responses, I cant quite figure out how using a Tweedie Distribution and Gini index help overcome the problem of non-constant variance noise present in skewed distributions. Do you know of any web resources i can refer to help clarify this? Thanks for your time!
", "rawMarkdown": "@dmitriyguller , thanks for sharing your insight. While its intuitive that RMSE will optimise for large valued responses, I cant quite figure out how using a Tweedie Distribution and Gini index help overcome the problem of non-constant variance noise present in skewed distributions. Do you know of any web resources i can refer to help clarify this? Thanks for your time!" }, { "id": 807554, "postDate": "2020-04-14T17:58:14.603Z", "content": "@dmitriyguller Thank you for the explanation, it was really helpful. Could you please help me with below questions:
\n\nHow do you calculate Gini coefficient for regression target, could you please point me to any resources for the same. Would it be okay to use Gini coefficient to judge rank prediction ?\nI was trying to use Tweedie loss with lightgbm but when I plot the distribution of target and predictions, I don't see the spike on zero predictions. It seems model is still learning mean of the target(same as RMSE) rather than learning two/three modal distribution. Have you faced this while fitting Tweedie distribution to the GLM model ?
", "rawMarkdown": "@dmitriyguller Thank you for the explanation, it was really helpful. Could you please help me with below questions:\n\nHow do you calculate Gini coefficient for regression target, could you please point me to any resources for the same. Would it be okay to use Gini coefficient to judge rank prediction ?\nI was trying to use Tweedie loss with lightgbm but when I plot the distribution of target and predictions, I don't see the spike on zero predictions. It seems model is still learning mean of the target(same as RMSE) rather than learning two/three modal distribution. Have you faced this while fitting Tweedie distribution to the GLM model ?\n" } ] }, { "id": 662972, "postDate": "2019-11-01T09:25:39.747Z", "content": "Thanks for pointing out this.
", "rawMarkdown": "Thanks for pointing out this.", "votes": 1, "replies": [ { "id": 812444, "postDate": "2020-04-18T18:50:59.030Z", "rawMarkdown": "", "votes": 1 } ] }, { "id": 651417, "postDate": "2019-10-17T13:25:22.043Z", "content": "I'm probably missing something, can someone please explain why all the published notebooks have the RMSLE of validation set ~0.7, but that is so different from their scores against the test set ~1.4?
", "rawMarkdown": "I'm probably missing something, can someone please explain why all the published notebooks have the RMSLE of validation set ~0.7, but that is so different from their scores against the test set ~1.4?", "votes": 1, "replies": [ { "id": 651429, "postDate": "2019-10-17T13:34:34.047Z", "content": "@nerijusareska because the lgbm model's use RMSE not RMSLE.\n
Plus the published notebooks haven't found a good way to cross validate yet
", "rawMarkdown": "Plus the published notebooks haven't found a good way to cross validate yet" }, { "id": 651482, "postDate": "2019-10-17T14:29:03.390Z", "content": "I think most of the public kernels use RMSE of the np.lop1p which should be equivalent to the RMSLE, i.e.:\nsqrt( mean( ( lop1p(y) - lop1p(pred) )**2 ))\nright?
About the LB vs. CV, well, you are training and validating on the same year of data, but trying to predicting the next 2 years after that!\nThat's a quite different task, so the scores should barely correlate at all.
", "rawMarkdown": "I think most of the public kernels use RMSE of the np.lop1p which should be equivalent to the RMSLE, i.e.:\n`sqrt( mean( ( lop1p(y) - lop1p(pred) )**2 ))`\nright?\n\nAbout the LB vs. CV, well, you are training and validating on the same year of data, but trying to predicting the next 2 years after that!\nThat's a quite different task, so the scores should barely correlate at all.", "votes": 6 }, { "id": 651585, "postDate": "2019-10-17T16:29:42.497Z", "content": "Yea I think they missed out using a custom loss function for lgbm
", "rawMarkdown": "Yea I think they missed out using a custom loss function for lgbm" }, { "id": 652045, "postDate": "2019-10-18T08:59:50.307Z", "content": "\n\n\nI think most of the public kernels use RMSE of the np.lop1p which should be equivalent to the RMSLE, i.e.:\n sqrt( mean( ( lop1p(y) - lop1p(pred) )**2 ))\n right?
\n
Yes, it is right! One could simply check that by using sklearn's MSE and MSLE:
\n\n\ny = np.random.rand(10)\ny_hat = np.random.rand(10)\nprint(np.sqrt(mean_squared_log_error(y_hat, y)))\nprint(np.sqrt(mean_squared_error(np.log1p(y_hat), np.log1p(y))))\n\nOf course we need also apply np.expm1() to convert the predictions back...
So, I guess the gap between CV and PublicLB is due to 2 reasons:\n- CV setup. I'd definitely try TimeSeriesSplit (build consistent validation is always tough in time-series comps :smile: )\n- Train vs Test differences
", "rawMarkdown": "> I think most of the public kernels use RMSE of the np.lop1p which should be equivalent to the RMSLE, i.e.:\nsqrt( mean( ( lop1p(y) - lop1p(pred) )**2 ))\nright?\n\nYes, it is right! One could simply check that by using sklearn's MSE and MSLE:\n\n```\ny = np.random.rand(10)\ny_hat = np.random.rand(10)\nprint(np.sqrt(mean_squared_log_error(y_hat, y)))\nprint(np.sqrt(mean_squared_error(np.log1p(y_hat), np.log1p(y))))\n```\nOf course we need also apply `np.expm1()` to convert the predictions back...\n\nSo, I guess the gap between CV and PublicLB is due to 2 reasons:\n- CV setup. I'd definitely try TimeSeriesSplit (build consistent validation is always tough in time-series comps :smile: )\n- Train vs Test differences" } ] }, { "id": 651379, "postDate": "2019-10-17T12:39:09.983Z", "content": "\n", "rawMarkdown": "> the most unique property of the RMLSE that it penalizes the underestimation of the actual value more severely than it does for the Overestimation.> \nThis shall help a lot if kept into consideration.\nThanks!", "votes": 1, "replies": [ { "id": 812443, "postDate": "2020-04-18T18:50:46.650Z", "rawMarkdown": "" } ] }, { "id": 650950, "postDate": "2019-10-16T21:44:12.070Z", "content": "the most unique property of the RMLSE that it penalizes the underestimation of the actual value more severely than it does for the Overestimation.> \n This shall help a lot if kept into consideration.\n Thanks!
\n
you can also use np.log1p and np.mean instead of the math.* ... just saying :)
", "rawMarkdown": "you can also use np.log1p and np.mean instead of the math.* ... just saying :)", "votes": 2 }, { "id": 867746, "postDate": "2020-05-30T15:25:27.820Z", "content": "Is it a better metric for estimating model accuracy?
", "rawMarkdown": "Is it a better metric for estimating model accuracy?" }, { "id": 811805, "postDate": "2020-04-18T08:40:26.213Z", "content": "How is accuracy measured from this?
", "rawMarkdown": "How is accuracy measured from this?" }, { "id": 657070, "postDate": "2019-10-24T22:34:56.133Z", "content": "TLDR version;
\n\nRMSE is a kin (very very close) to the standard deviation. RMSLE is identical except you take the log of the value first.
\n\nThis means while in RMSE you are comparing actual values (call this value y), in RMSLE you are comparing the exponents (call these x ... the comparison is y = e ^ x (e to the power x)). in short RMSLE compares not the value but the powers.
\n\nOr perhaps an easier way to visualize this, it's like comparing how many digits it takes to make a number vs the number itself. ... so two 8 digit numbers have about a gap of about 0. and the gap between an 8 digit number and a 7 digit number is about 1 which is about the same gap between a 3 digit and 2 digit number. RMSLE is adjusting for relative scale of a particular result.
", "rawMarkdown": "TLDR version;\n\nRMSE is a kin (very very close) to the standard deviation. RMSLE is identical except you take the log of the value first. \n\nThis means while in RMSE you are comparing actual values (call this value y), in RMSLE you are comparing the exponents (call these x ... the comparison is y = e ^ x (e to the power x)). in short RMSLE compares not the value but the powers.\n\nOr perhaps an easier way to visualize this, it's like comparing how many digits it takes to make a number vs the number itself. ... so two 8 digit numbers have about a gap of about 0. and the gap between an 8 digit number and a 7 digit number is about 1 which is about the same gap between a 3 digit and 2 digit number. RMSLE is adjusting for relative scale of a particular result. \n", "replies": [ { "id": 657071, "postDate": "2019-10-24T22:35:59.003Z", "content": "I can only assume they wanted the score in this manner as they feel buildings produce consistent variation but the variation is scaled up as the buildings power usage gets bigger. ie a 5 story sky scrapper vs a 50 sky scrapper are nearly identical. It is just 1 is a strict multiplication in power consumption compared to the other. the highs and lows scale identically.
", "rawMarkdown": "I can only assume they wanted the score in this manner as they feel buildings produce consistent variation but the variation is scaled up as the buildings power usage gets bigger. ie a 5 story sky scrapper vs a 50 sky scrapper are nearly identical. It is just 1 is a strict multiplication in power consumption compared to the other. the highs and lows scale identically." }, { "id": 657074, "postDate": "2019-10-24T22:49:15.717Z", "content": "The buildings better produce constant variation of energy use on a log scale (or more accurately, the meter reading + 1 should have a constant variation on the log scale). One fun fact about RMSLE is that the bias of the optimal estimate is a function of the standard deviation of the target variable (on the log scale). If meters readings don't have a constant standard deviation on the log scale, then a less efficient building on the scale you get billed for by utilities may actually appear to be a more efficient building on the log scale.
", "rawMarkdown": "The buildings better produce constant variation of energy use on a log scale (or more accurately, the meter reading + 1 should have a constant variation on the log scale). One fun fact about RMSLE is that the bias of the optimal estimate is a function of the standard deviation of the target variable (on the log scale). If meters readings don't have a constant standard deviation on the log scale, then a less efficient building on the scale you get billed for by utilities may actually appear to be a more efficient building on the log scale." } ] }, { "id": 807549, "postDate": "2020-04-14T17:56:45.503Z", "rawMarkdown": "", "isDeleted": true }, { "id": 920730, "postDate": "2020-07-08T19:10:21.370Z", "content": "Good explanation. It helped me. Thanks!
", "rawMarkdown": "Good explanation. It helped me. Thanks!" } ], "comments": [ { "id": 650910, "author_name": "Dmitriy Guller", "author_url": "", "post_date": "2019-10-16T20:33:55.533000", "content": "RMSLE, especially the plus one version of it, is easily my least favorite metric on Kaggle. It's a kludge metric that you use when you don't know how to deal with skewed non-negative response variables. One problem with that metric is that it penalizes the models that actually give you an unbiased estimate of the target.
", "votes": 15, "replies": [ { "id": 655035, "author_name": "Caesar Lupum", "author_url": "", "post_date": "2019-10-22T16:12:16.903000", "content": "This problem it's like a 'forecasting time series models', RMSE may be better than RMSLE\nand so good measure of errors that can serve as a loss functions to minimize.\nWhat do you thing about ?
\n\nRMSE: It is symmetric and quadratic, which is suitable for Gaussian noises.\nMore generally, minimizing RMSE finds an approximation for the conditional expected value of the next observation (to be predicted) given the explanatory variables (the past in time series).
\n\n", "votes": 0, "replies": [] }, { "id": 655064, "author_name": "Dmitriy Guller", "author_url": "", "post_date": "2019-10-22T16:48:48.720000", "content": "RMSE is not a good metric either for skewed distributions, because the noise is unlikely to be Gaussian with constant variance. If you use RMSE on a skewed response variable, your fit statistic is going to be mainly driven by the observations of the highest magnitude.
\n\nWe have this problem all the time in insurance applications. Consider a typical model to predict auto insurance lost cost: the mean may be something like $500, the vast majority of observations would be $0, but some could go into $100,000 area or higher. We don't model log1p(auto insurance losses), as that would result in a model that's distorted in all kinds of ways. We typically use a Tweedie distribution to fit the GLM model, and a Gini index to evaluate it.
Gini index is a non-parametric measure, and the advantage of it is that it is agnostic to what you assume about the distribution of your target variable. Most of the other metrics, including RMSE, RMSLE, RMSL1pE, MAE, MAPE, etc., are not. When you have a non-negative response variable, you can never go wrong with a Gini index, but you can easily railroad your models to go off into stupid directions if you make a wrong choice of a distance-based metric. RMSL1pE in particular is a wrong choice for applications where you want your model to make sense and be useful.
", "votes": 18, "replies": [] }, { "id": 655091, "author_name": "Caesar Lupum", "author_url": "", "post_date": "2019-10-22T17:17:44.440000", "content": "Thanks for helpful response sir !✔️
", "votes": 0, "replies": [] }, { "id": 658153, "author_name": "Carlo", "author_url": "", "post_date": "2019-10-25T18:00:52.340000", "content": "Thank you for the explanation @dmitriyguller! I've learned a lot from it!
", "votes": 1, "replies": [] }, { "id": 663022, "author_name": "YaGana Sheriff-Hussaini", "author_url": "", "post_date": "2019-11-01T10:55:30.850000", "content": "We typically use a Tweedie distribution to fit the GLM model, and a Gini index to evaluate it.
@dmitriyguller, thanks for your insights. Is Gini index the same as the Normalized Gini Coefficient?
", "votes": 0, "replies": [] }, { "id": 663076, "author_name": "Dmitriy Guller", "author_url": "", "post_date": "2019-11-01T12:23:00.653000", "content": "Yes, that's the same thing.
", "votes": 1, "replies": [] }, { "id": 762478, "author_name": "Data Enthusiast", "author_url": "", "post_date": "2020-03-03T14:47:48.323000", "content": "@dmitriyguller , thanks for sharing your insight. While its intuitive that RMSE will optimise for large valued responses, I cant quite figure out how using a Tweedie Distribution and Gini index help overcome the problem of non-constant variance noise present in skewed distributions. Do you know of any web resources i can refer to help clarify this? Thanks for your time!
", "votes": 0, "replies": [] }, { "id": 807554, "author_name": "Neha", "author_url": "", "post_date": "2020-04-14T17:58:14.603000", "content": "@dmitriyguller Thank you for the explanation, it was really helpful. Could you please help me with below questions:
\n\nHow do you calculate Gini coefficient for regression target, could you please point me to any resources for the same. Would it be okay to use Gini coefficient to judge rank prediction ?\nI was trying to use Tweedie loss with lightgbm but when I plot the distribution of target and predictions, I don't see the spike on zero predictions. It seems model is still learning mean of the target(same as RMSE) rather than learning two/three modal distribution. Have you faced this while fitting Tweedie distribution to the GLM model ?
", "votes": 0, "replies": [] } ] }, { "id": 662972, "author_name": "LongYin/杰少", "author_url": "", "post_date": "2019-11-01T09:25:39.747000", "content": "Thanks for pointing out this.
", "votes": 1, "replies": [ { "id": 812444, "author_name": "Carlo", "author_url": "", "post_date": "2020-04-18T18:50:59.030000", "content": "", "votes": 1, "replies": [] } ] }, { "id": 651417, "author_name": "Nerijus Areska", "author_url": "", "post_date": "2019-10-17T13:25:22.043000", "content": "I'm probably missing something, can someone please explain why all the published notebooks have the RMSLE of validation set ~0.7, but that is so different from their scores against the test set ~1.4?
", "votes": 1, "replies": [ { "id": 651429, "author_name": "Nanashi", "author_url": "", "post_date": "2019-10-17T13:34:34.047000", "content": "@nerijusareska because the lgbm model's use RMSE not RMSLE.\n
Plus the published notebooks haven't found a good way to cross validate yet
", "votes": 0, "replies": [] }, { "id": 651482, "author_name": "Henrique Mendonça", "author_url": "", "post_date": "2019-10-17T14:29:03.390000", "content": "I think most of the public kernels use RMSE of the np.lop1p which should be equivalent to the RMSLE, i.e.:\nsqrt( mean( ( lop1p(y) - lop1p(pred) )**2 ))\nright?
About the LB vs. CV, well, you are training and validating on the same year of data, but trying to predicting the next 2 years after that!\nThat's a quite different task, so the scores should barely correlate at all.
", "votes": 6, "replies": [] }, { "id": 651585, "author_name": "Daniel", "author_url": "", "post_date": "2019-10-17T16:29:42.497000", "content": "Yea I think they missed out using a custom loss function for lgbm
", "votes": 0, "replies": [] }, { "id": 652045, "author_name": "Federico Raimondi Cominesi", "author_url": "", "post_date": "2019-10-18T08:59:50.307000", "content": "\n\n\nI think most of the public kernels use RMSE of the np.lop1p which should be equivalent to the RMSLE, i.e.:\n sqrt( mean( ( lop1p(y) - lop1p(pred) )**2 ))\n right?
\n
Yes, it is right! One could simply check that by using sklearn's MSE and MSLE:
\n\n\ny = np.random.rand(10)\ny_hat = np.random.rand(10)\nprint(np.sqrt(mean_squared_log_error(y_hat, y)))\nprint(np.sqrt(mean_squared_error(np.log1p(y_hat), np.log1p(y))))\n\nOf course we need also apply np.expm1() to convert the predictions back...
So, I guess the gap between CV and PublicLB is due to 2 reasons:\n- CV setup. I'd definitely try TimeSeriesSplit (build consistent validation is always tough in time-series comps :smile: )\n- Train vs Test differences
", "votes": 0, "replies": [] } ] }, { "id": 651379, "author_name": "Mohammad Sohaib", "author_url": "", "post_date": "2019-10-17T12:39:09.983000", "content": "\n", "votes": 1, "replies": [ { "id": 812443, "author_name": "Carlo", "author_url": "", "post_date": "2020-04-18T18:50:46.650000", "content": "", "votes": 0, "replies": [] } ] }, { "id": 650950, "author_name": "Henrique Mendonça", "author_url": "", "post_date": "2019-10-16T21:44:12.070000", "content": "the most unique property of the RMLSE that it penalizes the underestimation of the actual value more severely than it does for the Overestimation.> \n This shall help a lot if kept into consideration.\n Thanks!
\n
you can also use np.log1p and np.mean instead of the math.* ... just saying :)
", "votes": 2, "replies": [] }, { "id": 867746, "author_name": "Digvijay Yadav", "author_url": "", "post_date": "2020-05-30T15:25:27.820000", "content": "Is it a better metric for estimating model accuracy?
", "votes": 0, "replies": [] }, { "id": 811805, "author_name": "Digvijay Yadav", "author_url": "", "post_date": "2020-04-18T08:40:26.213000", "content": "How is accuracy measured from this?
", "votes": 0, "replies": [] }, { "id": 657070, "author_name": "j_scheibel", "author_url": "", "post_date": "2019-10-24T22:34:56.133000", "content": "TLDR version;
\n\nRMSE is a kin (very very close) to the standard deviation. RMSLE is identical except you take the log of the value first.
\n\nThis means while in RMSE you are comparing actual values (call this value y), in RMSLE you are comparing the exponents (call these x ... the comparison is y = e ^ x (e to the power x)). in short RMSLE compares not the value but the powers.
\n\nOr perhaps an easier way to visualize this, it's like comparing how many digits it takes to make a number vs the number itself. ... so two 8 digit numbers have about a gap of about 0. and the gap between an 8 digit number and a 7 digit number is about 1 which is about the same gap between a 3 digit and 2 digit number. RMSLE is adjusting for relative scale of a particular result.
", "votes": 0, "replies": [ { "id": 657071, "author_name": "j_scheibel", "author_url": "", "post_date": "2019-10-24T22:35:59.003000", "content": "I can only assume they wanted the score in this manner as they feel buildings produce consistent variation but the variation is scaled up as the buildings power usage gets bigger. ie a 5 story sky scrapper vs a 50 sky scrapper are nearly identical. It is just 1 is a strict multiplication in power consumption compared to the other. the highs and lows scale identically.
", "votes": 0, "replies": [] }, { "id": 657074, "author_name": "Dmitriy Guller", "author_url": "", "post_date": "2019-10-24T22:49:15.717000", "content": "The buildings better produce constant variation of energy use on a log scale (or more accurately, the meter reading + 1 should have a constant variation on the log scale). One fun fact about RMSLE is that the bias of the optimal estimate is a function of the standard deviation of the target variable (on the log scale). If meters readings don't have a constant standard deviation on the log scale, then a less efficient building on the scale you get billed for by utilities may actually appear to be a more efficient building on the log scale.
", "votes": 0, "replies": [] } ] }, { "id": 807549, "author_name": "", "author_url": "", "post_date": "2020-04-14T17:56:45.503000", "content": "", "votes": 0, "replies": [] }, { "id": 920730, "author_name": "Ancipes", "author_url": "", "post_date": "2020-07-08T19:10:21.370000", "content": "Good explanation. It helped me. Thanks!
", "votes": 0, "replies": [] } ], "raw_markdown_by_id": { "650862": "**[What is the difference between an RMSE and RMSLE (logarithmic error), and does a high RMSE imply low RMSLE?](https://www.quora.com/What-is-the-difference-between-an-RMSE-and-RMSLE-logarithmic-error-and-does-a-high-RMSE-imply-low-RMSLE)**\n\nRoot Mean Squared Error (**RMSE**) and Root Mean Squared Logarithmic Error (**RMSLE**) both are the techniques to find out the difference between the values predicted by your machine learning model and the actual values.\n\nTo understand these concepts and their differences, it is important to know what does Mean Squared Error (MSE) mean. MSE incorporates both the variance and the bias of the predictor. RMSE is the square root of MSE. In case of unbiased estimator, RMSE is just the square root of variance, which is actually Standard Deviation.\n\nIn case of RMSLE, you take the log of the predictions and actual values. So basically, what changes is the variance that you are measuring. I believe RMSLE is usually used when you don't want to penalize huge differences in the predicted and the actual values when both predicted and true values are huge numbers.\n\n- If both predicted and actual values are small: RMSE and RMSLE is same.\n- If either predicted or the actual value is big: RMSE > RMSLE\n- If both predicted and actual values are big: RMSE > RMSLE (RMSLE becomes almost negligible)\n\nThe **Robustness** of RMSLE to the outliers, the property of calculating the relative error between the Predicted and Actual Values, the most unique property of the RMLSE that it **penalizes the underestimation** of the actual value more severely than it does for the Overestimation.\n\n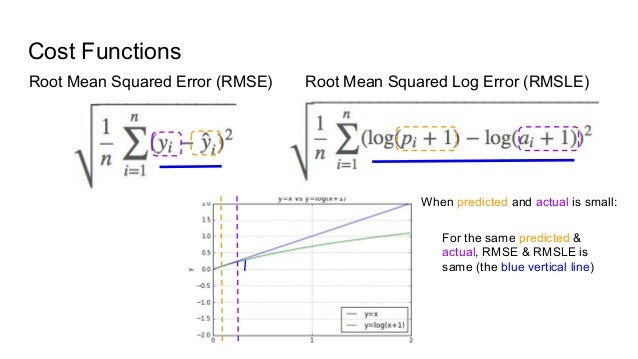\n\n