
As we are still waiting for the private leaderboard I have decided to share our solution that led us to the 40th place at public LB.\nEnjoy the reading, good luck with a shakeup and a happy new year to everyone.
\n\nThe best score boost in this competition was achieved thanks to data cleaning. There are plenty of training examples that might be removed. For example building_id's from 0 to 104 have all 0's (or almost 0's) for the period starting from January 1st 2016 until May 20th 2016. So all of this samples should be removed from the training set.\n
Some buildings have suspicious 0 readings somewhere in the middle, like building_id 1066\n \nCode to remove data:\n
\"not (building_id == 1066 & meter == 0 & timestamp >= \"2016-02-13 20:00:00\" & timestamp <= \"2016-02-29 11:00:00\")\"
And another example - building_id 1250 & meter 2. It has all 0's until the middle of December. So my guess was that this type of meter was not functioning, but started at December. Based on that guess the small amount of non-zero data is very useful, especially because the readings are so high (around 8000).\n \nCode to remove data:\n
\"not (building_id == 1250 & meter == 2 & timestamp < \"2016-12-21 16:00:00\")\"
I have been using my plots from this post to visually understand which readings might be removed.
\n\nOverall our file with data cleaning queries contains 102 lanes. That is including both training set and leaked set. Yes, we did cleaned leaked data and used it as a training examples.
\n\n2 Folds strategy from Half and half showed a really good performance. But since it splits all data simply in the middle it has disadvantages because some of the buildings have samples only starting from June, July or even November. So they will be only presented in one fold.
\n\nSo I have created a slightly different strategy - using half and half, but now for the whole training set, but for every meter of every building in it. In other words - if building have readings only for 6 months, starting from July, then 1st fold will contain all the readings from July till September and 2nd fold will contain readings from September till December.
\n\nBelow is a picture with an example. Pay attention that data for building_id 555 starts only from July.\n
And here is the code to create two folds for the whole dataset, splitting each meter of each buildings somewhere in the middle:
\n\n```\nfold1 = []\nfold2 = []\nfolds = [fold1, fold2]
\n\nfor building in tqdm_notebook(range(1449)):\n # And over each possible meter type for each building\n for meter in range(4):\n sub_df = train[(train['building_id']==building) & (train['meter']==meter)]\n # Dividing by two, because we will train on 2 folds\n samples = int(sub_df.shape[0] / 2)\n # If there are any samples for the specific meter type of the specific building...\n if samples:\n # Filling indexes for both folds. \n # They will be splitted by time, since at this moment train is sorted by time.\n fold1 += list(sub_df.index[:samples])\n fold2 += list(sub_df.index[samples:])\n```
\n\nThis CV strategy performs better and OOF score better aligns with LB.
\n\nWe have used around 50 features in our model. Some of the features are well known from public kernels, such as lags. But some of them were mined using CV strategy.
\n\nOne of the features is a temperature difference between two readings for each building_id. It improved a score a bit.\nCode example:\ntrain['air_temperature_diff1'] = train['air_temperature'] - train.groupby(['building_id', 'meter'])['air_temperature'].shift(1)
Also we have used holidays as a features, SIN\\COS transformations and so on.
\n\nWe mostly used LightGBM as it showed best performance. I believe we used only one CatBoost model for the blending. Neural Network didn't show a good performance.\nFinal submission is a blend of around 10 models (or some number around that).
\n\nYes, we used leaked data both for training and in the submission file to replace our predictions with ground truth labels.
", "messages": [ { "id": "701287", "postDate": "12/23/2019 10:08:28", "content": "As we are still waiting for the private leaderboard I have decided to share our solution that led us to the 40th place at public LB.\nEnjoy the reading, good luck with a shakeup and a happy new year to everyone.
\n\nThe best score boost in this competition was achieved thanks to data cleaning. There are plenty of training examples that might be removed. For example building_id's from 0 to 104 have all 0's (or almost 0's) for the period starting from January 1st 2016 until May 20th 2016. So all of this samples should be removed from the training set.\n
Some buildings have suspicious 0 readings somewhere in the middle, like building_id 1066\n\nCode to remove data:\n\"not (building_id == 1066 & meter == 0 & timestamp >= \"2016-02-13 20:00:00\" & timestamp <= \"2016-02-29 11:00:00\")\"
And another example - building_id 1250 & meter 2. It has all 0's until the middle of December. So my guess was that this type of meter was not functioning, but started at December. Based on that guess the small amount of non-zero data is very useful, especially because the readings are so high (around 8000).\n\nCode to remove data:\n\"not (building_id == 1250 & meter == 2 & timestamp < \"2016-12-21 16:00:00\")\"
I have been using my plots from this post to visually understand which readings might be removed.
\n\nOverall our file with data cleaning queries contains 102 lanes. That is including both training set and leaked set. Yes, we did cleaned leaked data and used it as a training examples.
\n\n2 Folds strategy from Half and half showed a really good performance. But since it splits all data simply in the middle it has disadvantages because some of the buildings have samples only starting from June, July or even November. So they will be only presented in one fold.
\n\nSo I have created a slightly different strategy - using half and half, but now for the whole training set, but for every meter of every building in it. In other words - if building have readings only for 6 months, starting from July, then 1st fold will contain all the readings from July till September and 2nd fold will contain readings from September till December.
\n\nBelow is a picture with an example. Pay attention that data for building_id 555 starts only from July.\n
And here is the code to create two folds for the whole dataset, splitting each meter of each buildings somewhere in the middle:
\n\n```\nfold1 = []\nfold2 = []\nfolds = [fold1, fold2]
\n\nfor building in tqdm_notebook(range(1449)):\n # And over each possible meter type for each building\n for meter in range(4):\n sub_df = train[(train['building_id']==building) & (train['meter']==meter)]\n # Dividing by two, because we will train on 2 folds\n samples = int(sub_df.shape[0] / 2)\n # If there are any samples for the specific meter type of the specific building...\n if samples:\n # Filling indexes for both folds. \n # They will be splitted by time, since at this moment train is sorted by time.\n fold1 += list(sub_df.index[:samples])\n fold2 += list(sub_df.index[samples:])\n```
\n\nThis CV strategy performs better and OOF score better aligns with LB.
\n\nWe have used around 50 features in our model. Some of the features are well known from public kernels, such as lags. But some of them were mined using CV strategy.
\n\nOne of the features is a temperature difference between two readings for each building_id. It improved a score a bit.\nCode example:\ntrain['air_temperature_diff1'] = train['air_temperature'] - train.groupby(['building_id', 'meter'])['air_temperature'].shift(1)
Also we have used holidays as a features, SIN\\COS transformations and so on.
\n\nWe mostly used LightGBM as it showed best performance. I believe we used only one CatBoost model for the blending. Neural Network didn't show a good performance.\nFinal submission is a blend of around 10 models (or some number around that).
\n\nYes, we used leaked data both for training and in the submission file to replace our predictions with ground truth labels.
", "rawMarkdown": "As we are still waiting for the private leaderboard I have decided to share our solution that led us to the 40th place at public LB.\nEnjoy the reading, good luck with a shakeup and a happy new year to everyone.\n\n# Data cleaning\nThe best score boost in this competition was achieved thanks to data cleaning. There are plenty of training examples that might be removed. For example building_id's from 0 to 104 have all 0's (or almost 0's) for the period starting from January 1st 2016 until May 20th 2016. So all of this samples should be removed from the training set.\n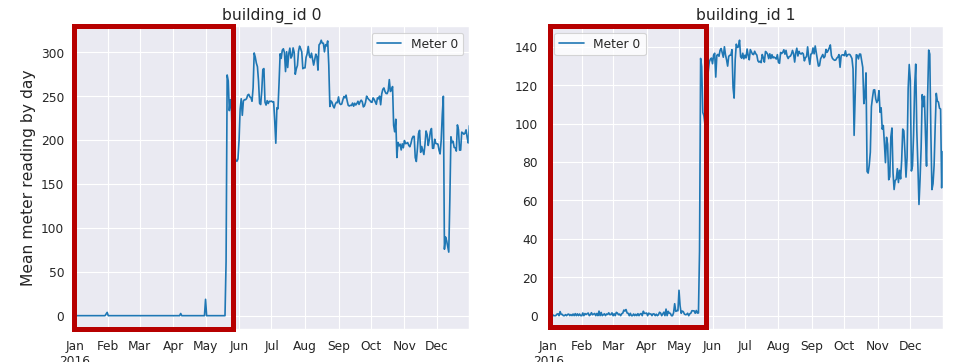\n\nSome buildings have suspicious 0 readings somewhere in the middle, like building_id 1066\n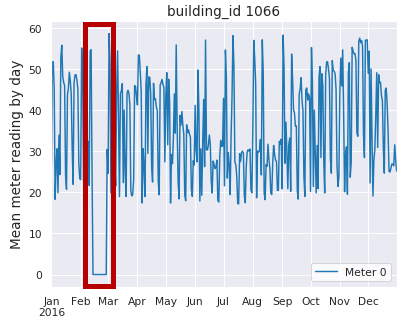\nCode to remove data:\n`\"not (building_id == 1066 & meter == 0 & timestamp >= \"2016-02-13 20:00:00\" & timestamp <= \"2016-02-29 11:00:00\")\"`\n\nAnd another example - building_id 1250 & meter 2. It has all 0's until the middle of December. So my guess was that this type of meter was not functioning, but started at December. Based on that guess the small amount of non-zero data is very useful, especially because the readings are so high (around 8000).\n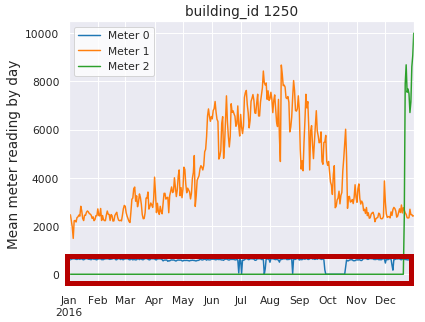\nCode to remove data:\n`\"not (building_id == 1250 & meter == 2 & timestamp < \"2016-12-21 16:00:00\")\"`\n\nI have been using my plots from [this post](https://www.kaggle.com/c/ashrae-energy-prediction/discussion/115248) to visually understand which readings might be removed.\n\nOverall our file with data cleaning queries contains 102 lanes. That is including both training set and leaked set. Yes, we did cleaned leaked data and used it as a training examples.\n\n# CV strategy\n2 Folds strategy from [Half and half](https://www.kaggle.com/rohanrao/ashrae-half-and-half) showed a really good performance. But since it splits all data simply in the middle it has disadvantages because some of the buildings have samples only starting from June, July or even November. So they will be only presented in one fold.\n\nSo I have created a slightly different strategy - using half and half, but now for the whole training set, but for every meter of every building in it. In other words - if building have readings only for 6 months, starting from July, then 1st fold will contain all the readings from July till September and 2nd fold will contain readings from September till December.\n\nBelow is a picture with an example. Pay attention that data for building_id 555 starts only from July.\n\n\nAnd here is the code to create two folds for the whole dataset, splitting each meter of each buildings somewhere in the middle:\n\n```\nfold1 = []\nfold2 = []\nfolds = [fold1, fold2]\n\n# Iterating over each building\nfor building in tqdm_notebook(range(1449)):\n # And over each possible meter type for each building\n for meter in range(4):\n sub_df = train[(train['building_id']==building) & (train['meter']==meter)]\n # Dividing by two, because we will train on 2 folds\n samples = int(sub_df.shape[0] / 2)\n # If there are any samples for the specific meter type of the specific building...\n if samples:\n # Filling indexes for both folds. \n # They will be splitted by time, since at this moment train is sorted by time.\n fold1 += list(sub_df.index[:samples])\n fold2 += list(sub_df.index[samples:])\n```\n\nThis CV strategy performs better and OOF score better aligns with LB.\n\n# Feature engineering\nWe have used around 50 features in our model. Some of the features are well known from public kernels, such as lags. But some of them were mined using CV strategy.\n\nOne of the features is a temperature difference between two readings for each building_id. It improved a score a bit.\nCode example:\n`train['air_temperature_diff1'] = train['air_temperature'] - train.groupby(['building_id', 'meter'])['air_temperature'].shift(1)`\n\nAlso we have used holidays as a features, SIN\\COS transformations and so on.\n\n# Model\nWe mostly used LightGBM as it showed best performance. I believe we used only one CatBoost model for the blending. Neural Network didn't show a good performance.\nFinal submission is a blend of around 10 models (or some number around that).\n\n# Leaked data\nYes, we used leaked data both for training and in the submission file to replace our predictions with ground truth labels.", "votes": null }, { "id": "701461", "postDate": "12/23/2019 14:10:48", "content": "Thanks for sharing. I really liked that you split each building's meters in half instead of just splitting entire training data in half. Of all the things I tried, this one managed to slip by me. One of the better splits I tried was splitting by hour, so first 12 hours and last 12 hours of the day, except I never included this model in my final blend. It seemed crazy at the time, but surprisingly the validation of both training and leaked test labels (sites 0,1,2,4,15) showed that it indeed performed better than normal half/half split. Reading your post makes me realize why it performed better and why I should have trusted my cv as I never submitted that model to LB.
", "rawMarkdown": "Thanks for sharing. I really liked that you split each building's meters in half instead of just splitting entire training data in half. Of all the things I tried, this one managed to slip by me. One of the better splits I tried was splitting by hour, so first 12 hours and last 12 hours of the day, except I never included this model in my final blend. It seemed crazy at the time, but surprisingly the validation of both training and leaked test labels (sites 0,1,2,4,15) showed that it indeed performed better than normal half/half split. Reading your post makes me realize why it performed better and why I should have trusted my cv as I never submitted that model to LB.", "votes": null }, { "id": "701477", "postDate": "12/23/2019 14:25:10", "content": "Thanks
", "rawMarkdown": "Thanks", "votes": null }, { "id": "701515", "postDate": "12/23/2019 15:10:58", "content": "Thanks for this. Re CV strategy, therefore you built a model per building and meter?
", "rawMarkdown": "Thanks for this. Re CV strategy, therefore you built a model per building and meter?", "votes": null }, { "id": "701524", "postDate": "12/23/2019 15:22:39", "content": "Nice work!👍
", "rawMarkdown": "Nice work!👍", "votes": null }, { "id": "701596", "postDate": "12/23/2019 16:38:16", "content": "Thanks for this really good explanation and amazing solution. Could you please elaborate on how you looked for outliers in building's readings? What I mean is: There are over a 1000 buildings, so it's rather impractical to plot one by one and determine in each one what to remove. Did you automate this process by any chance? If so how did you do it?
", "rawMarkdown": "Thanks for this really good explanation and amazing solution. Could you please elaborate on how you looked for outliers in building's readings? What I mean is: There are over a 1000 buildings, so it's rather impractical to plot one by one and determine in each one what to remove. Did you automate this process by any chance? If so how did you do it?", "votes": null }, { "id": "702070", "postDate": "12/24/2019 08:16:05", "content": "Thanks for the detailed explanation. Plese elaborate how you looked for outliers.
", "rawMarkdown": "Thanks for the detailed explanation. Plese elaborate how you looked for outliers.", "votes": null }, { "id": "702091", "postDate": "12/24/2019 08:49:00", "content": "> Did you automate this process by any chance?
\n\nWell, I was using a biological neural network. My own :)
\n\nI was manually cleaning the data. To decide what might (and should) be cleaned I looked at every plot for every building. It really takes less than a second per plot to realize if there is anything wrong with data.
", "rawMarkdown": "> Did you automate this process by any chance?\n\nWell, I was using a biological neural network. My own :)\n\nI was manually cleaning the data. To decide what might (and should) be cleaned I looked at every plot for every building. It really takes less than a second per plot to realize if there is anything wrong with data.", "votes": null }, { "id": "702198", "postDate": "12/24/2019 11:30:24", "content": "I did the same. I figured if doing the hard and less attractive work meant achieving a better score, I just had to bite the bullet. Some meters could be easily cleaned by looking at heat maps, those were easy to clean, but the rest required going through each individual building meter plot. There was diminishing return as well.
", "rawMarkdown": "I did the same. I figured if doing the hard and less attractive work meant achieving a better score, I just had to bite the bullet. Some meters could be easily cleaned by looking at [heat maps](https://www.kaggle.com/ganfear/missing-data-and-zeros-visualized), those were easy to clean, but the rest required going through each individual building meter plot. There was diminishing return as well.", "votes": null }, { "id": "702440", "postDate": "12/24/2019 17:12:42", "content": "I understand, thanks a lot for clearing that up! Also really liked your validation technique.
", "rawMarkdown": "I understand, thanks a lot for clearing that up! Also really liked your validation technique.", "votes": null }, { "id": "703783", "postDate": "12/26/2019 16:06:12", "content": "Thanks for the detailed explanation ! CONGRATS !
", "rawMarkdown": "Thanks for the detailed explanation ! CONGRATS !", "votes": null }, { "id": "717400", "postDate": "01/13/2020 04:36:39", "content": "Thank you very much @nroman for sharing! We would like to add your solution to our analysis of the top processes and models. Please let us know how you would like to be acknowledged. The default will be what you have on your profile. Thanks again!
\n\nAlso, for everyone else, we are in the process of curating a directory of Notebooks for building performance engineers and analysts from the competition that will serve as a recipe book for beginners as well as experts who are curious to learn about certain topics. We highly encourage you all to share your solutions (or any part of your process) as a notebook for this purpose. We will acknowledge the authors of all notebooks in this process, so please annotate your notebook or profile with how you would like to be acknowledged. We will also include general solutions and process information that is not in notebooks as well. It would also be helpful if you could indicate whether you are an ASHRAE member.
", "rawMarkdown": "Thank you very much @nroman for sharing! We would like to add your solution to our analysis of the top processes and models. Please let us know how you would like to be acknowledged. The default will be what you have on your profile. Thanks again!\n\n**Also, for everyone else, we are in the process of curating a directory of Notebooks for building performance engineers and analysts from the competition that will serve as a recipe book for beginners as well as experts who are curious to learn about certain topics. We highly encourage you all to share your solutions (or any part of your process) as a notebook for this purpose. We will acknowledge the authors of all notebooks in this process, so please annotate your notebook or profile with how you would like to be acknowledged. We will also include general solutions and process information that is not in notebooks as well. It would also be helpful if you could indicate whether you are an ASHRAE member.**", "votes": null }, { "id": "717466", "postDate": "01/13/2020 06:41:04", "content": "I've wrote you an emal via contact button in your profile.
", "rawMarkdown": "I've wrote you an emal via contact button in your profile.", "votes": null } ], "comments": [ { "id": 701461, "author_name": "teeyee314", "author_url": "", "post_date": "12/23/2019 14:10:48", "content": "Thanks for sharing. I really liked that you split each building's meters in half instead of just splitting entire training data in half. Of all the things I tried, this one managed to slip by me. One of the better splits I tried was splitting by hour, so first 12 hours and last 12 hours of the day, except I never included this model in my final blend. It seemed crazy at the time, but surprisingly the validation of both training and leaked test labels (sites 0,1,2,4,15) showed that it indeed performed better than normal half/half split. Reading your post makes me realize why it performed better and why I should have trusted my cv as I never submitted that model to LB.
", "votes": null, "replies": [] }, { "id": 701477, "author_name": "deb009", "author_url": "", "post_date": "12/23/2019 14:25:10", "content": "Thanks
", "votes": null, "replies": [] }, { "id": 701515, "author_name": "jonimatix", "author_url": "", "post_date": "12/23/2019 15:10:58", "content": "Thanks for this. Re CV strategy, therefore you built a model per building and meter?
", "votes": null, "replies": [] }, { "id": 701524, "author_name": "mimoudata", "author_url": "", "post_date": "12/23/2019 15:22:39", "content": "Nice work!👍
", "votes": null, "replies": [] }, { "id": 701596, "author_name": "prschdt", "author_url": "", "post_date": "12/23/2019 16:38:16", "content": "Thanks for this really good explanation and amazing solution. Could you please elaborate on how you looked for outliers in building's readings? What I mean is: There are over a 1000 buildings, so it's rather impractical to plot one by one and determine in each one what to remove. Did you automate this process by any chance? If so how did you do it?
", "votes": null, "replies": [ { "id": 702091, "author_name": "nroman", "author_url": "", "post_date": "12/24/2019 08:49:00", "content": "> Did you automate this process by any chance?
\n\nWell, I was using a biological neural network. My own :)
\n\nI was manually cleaning the data. To decide what might (and should) be cleaned I looked at every plot for every building. It really takes less than a second per plot to realize if there is anything wrong with data.
", "votes": null, "replies": [] }, { "id": 702198, "author_name": "teeyee314", "author_url": "", "post_date": "12/24/2019 11:30:24", "content": "I did the same. I figured if doing the hard and less attractive work meant achieving a better score, I just had to bite the bullet. Some meters could be easily cleaned by looking at heat maps, those were easy to clean, but the rest required going through each individual building meter plot. There was diminishing return as well.
", "votes": null, "replies": [] }, { "id": 702440, "author_name": "prschdt", "author_url": "", "post_date": "12/24/2019 17:12:42", "content": "I understand, thanks a lot for clearing that up! Also really liked your validation technique.
", "votes": null, "replies": [] } ] }, { "id": 702070, "author_name": "vishnurapps", "author_url": "", "post_date": "12/24/2019 08:16:05", "content": "Thanks for the detailed explanation. Plese elaborate how you looked for outliers.
", "votes": null, "replies": [] }, { "id": 703783, "author_name": "caesarlupum", "author_url": "", "post_date": "12/26/2019 16:06:12", "content": "Thanks for the detailed explanation ! CONGRATS !
", "votes": null, "replies": [] }, { "id": 717400, "author_name": "claytonmiller", "author_url": "", "post_date": "01/13/2020 04:36:39", "content": "Thank you very much @nroman for sharing! We would like to add your solution to our analysis of the top processes and models. Please let us know how you would like to be acknowledged. The default will be what you have on your profile. Thanks again!
\n\nAlso, for everyone else, we are in the process of curating a directory of Notebooks for building performance engineers and analysts from the competition that will serve as a recipe book for beginners as well as experts who are curious to learn about certain topics. We highly encourage you all to share your solutions (or any part of your process) as a notebook for this purpose. We will acknowledge the authors of all notebooks in this process, so please annotate your notebook or profile with how you would like to be acknowledged. We will also include general solutions and process information that is not in notebooks as well. It would also be helpful if you could indicate whether you are an ASHRAE member.
", "votes": null, "replies": [ { "id": 717466, "author_name": "nroman", "author_url": "", "post_date": "01/13/2020 06:41:04", "content": "I've wrote you an emal via contact button in your profile.
", "votes": null, "replies": [] } ] } ], "raw_markdown_by_id": { "701287": "As we are still waiting for the private leaderboard I have decided to share our solution that led us to the 40th place at public LB.\nEnjoy the reading, good luck with a shakeup and a happy new year to everyone.\n\n# Data cleaning\nThe best score boost in this competition was achieved thanks to data cleaning. There are plenty of training examples that might be removed. For example building_id's from 0 to 104 have all 0's (or almost 0's) for the period starting from January 1st 2016 until May 20th 2016. So all of this samples should be removed from the training set.\n\n\nSome buildings have suspicious 0 readings somewhere in the middle, like building_id 1066\n\nCode to remove data:\n`\"not (building_id == 1066 & meter == 0 & timestamp >= \"2016-02-13 20:00:00\" & timestamp <= \"2016-02-29 11:00:00\")\"`\n\nAnd another example - building_id 1250 & meter 2. It has all 0's until the middle of December. So my guess was that this type of meter was not functioning, but started at December. Based on that guess the small amount of non-zero data is very useful, especially because the readings are so high (around 8000).\n\nCode to remove data:\n`\"not (building_id == 1250 & meter == 2 & timestamp < \"2016-12-21 16:00:00\")\"`\n\nI have been using my plots from [this post](https://www.kaggle.com/c/ashrae-energy-prediction/discussion/115248) to visually understand which readings might be removed.\n\nOverall our file with data cleaning queries contains 102 lanes. That is including both training set and leaked set. Yes, we did cleaned leaked data and used it as a training examples.\n\n# CV strategy\n2 Folds strategy from [Half and half](https://www.kaggle.com/rohanrao/ashrae-half-and-half) showed a really good performance. But since it splits all data simply in the middle it has disadvantages because some of the buildings have samples only starting from June, July or even November. So they will be only presented in one fold.\n\nSo I have created a slightly different strategy - using half and half, but now for the whole training set, but for every meter of every building in it. In other words - if building have readings only for 6 months, starting from July, then 1st fold will contain all the readings from July till September and 2nd fold will contain readings from September till December.\n\nBelow is a picture with an example. Pay attention that data for building_id 555 starts only from July.\n\n\nAnd here is the code to create two folds for the whole dataset, splitting each meter of each buildings somewhere in the middle:\n\n```\nfold1 = []\nfold2 = []\nfolds = [fold1, fold2]\n\n# Iterating over each building\nfor building in tqdm_notebook(range(1449)):\n # And over each possible meter type for each building\n for meter in range(4):\n sub_df = train[(train['building_id']==building) & (train['meter']==meter)]\n # Dividing by two, because we will train on 2 folds\n samples = int(sub_df.shape[0] / 2)\n # If there are any samples for the specific meter type of the specific building...\n if samples:\n # Filling indexes for both folds. \n # They will be splitted by time, since at this moment train is sorted by time.\n fold1 += list(sub_df.index[:samples])\n fold2 += list(sub_df.index[samples:])\n```\n\nThis CV strategy performs better and OOF score better aligns with LB.\n\n# Feature engineering\nWe have used around 50 features in our model. Some of the features are well known from public kernels, such as lags. But some of them were mined using CV strategy.\n\nOne of the features is a temperature difference between two readings for each building_id. It improved a score a bit.\nCode example:\n`train['air_temperature_diff1'] = train['air_temperature'] - train.groupby(['building_id', 'meter'])['air_temperature'].shift(1)`\n\nAlso we have used holidays as a features, SIN\\COS transformations and so on.\n\n# Model\nWe mostly used LightGBM as it showed best performance. I believe we used only one CatBoost model for the blending. Neural Network didn't show a good performance.\nFinal submission is a blend of around 10 models (or some number around that).\n\n# Leaked data\nYes, we used leaked data both for training and in the submission file to replace our predictions with ground truth labels.", "701461": "Thanks for sharing. I really liked that you split each building's meters in half instead of just splitting entire training data in half. Of all the things I tried, this one managed to slip by me. One of the better splits I tried was splitting by hour, so first 12 hours and last 12 hours of the day, except I never included this model in my final blend. It seemed crazy at the time, but surprisingly the validation of both training and leaked test labels (sites 0,1,2,4,15) showed that it indeed performed better than normal half/half split. Reading your post makes me realize why it performed better and why I should have trusted my cv as I never submitted that model to LB.", "701477": "Thanks", "701515": "Thanks for this. Re CV strategy, therefore you built a model per building and meter?", "701524": "Nice work!👍", "701596": "Thanks for this really good explanation and amazing solution. Could you please elaborate on how you looked for outliers in building's readings? What I mean is: There are over a 1000 buildings, so it's rather impractical to plot one by one and determine in each one what to remove. Did you automate this process by any chance? If so how did you do it?", "702070": "Thanks for the detailed explanation. Plese elaborate how you looked for outliers.", "702091": "> Did you automate this process by any chance?\n\nWell, I was using a biological neural network. My own :)\n\nI was manually cleaning the data. To decide what might (and should) be cleaned I looked at every plot for every building. It really takes less than a second per plot to realize if there is anything wrong with data.", "702198": "I did the same. I figured if doing the hard and less attractive work meant achieving a better score, I just had to bite the bullet. Some meters could be easily cleaned by looking at [heat maps](https://www.kaggle.com/ganfear/missing-data-and-zeros-visualized), those were easy to clean, but the rest required going through each individual building meter plot. There was diminishing return as well.", "702440": "I understand, thanks a lot for clearing that up! Also really liked your validation technique.", "703783": "Thanks for the detailed explanation ! CONGRATS !", "717400": "Thank you very much @nroman for sharing! We would like to add your solution to our analysis of the top processes and models. Please let us know how you would like to be acknowledged. The default will be what you have on your profile. Thanks again!\n\n**Also, for everyone else, we are in the process of curating a directory of Notebooks for building performance engineers and analysts from the competition that will serve as a recipe book for beginners as well as experts who are curious to learn about certain topics. We highly encourage you all to share your solutions (or any part of your process) as a notebook for this purpose. We will acknowledge the authors of all notebooks in this process, so please annotate your notebook or profile with how you would like to be acknowledged. We will also include general solutions and process information that is not in notebooks as well. It would also be helpful if you could indicate whether you are an ASHRAE member.**", "717466": "I've wrote you an emal via contact button in your profile." }, "source": "meta" }