This section describes how to determine which values to predict for each figure type. These conventions ensure that predictions can be made in a consistent manner across a variety of chart formats. Be sure to review them carefully.
As a rule:
- Categorical values always correspond to a tick label on an axis.
- Numerical values must be inferred from the tick labels through interpolation.
### Bar ###
The dataset contains both **vertical bar** charts and **horizontal bar** charts. Vertical bar charts have their independent values along the x-axis and their dependent values along the y-axis, while horizontal bar charts have the roles of the axes switched. Independent values will always be categorical and can be identified as the series of tick-labels below each bar. Dependent values will always be numeric and are identified by the height (or length) of the bar.
#### Example - Vertical Bar ####
 For the figure above, the ground-truth is:
```
x,Alberta;Ontario;Quebec;P.E.I.,vertical_bar
y,62023;50355;56288;38621,vertical_bar
```
#### Example - Horizontal Bar ####
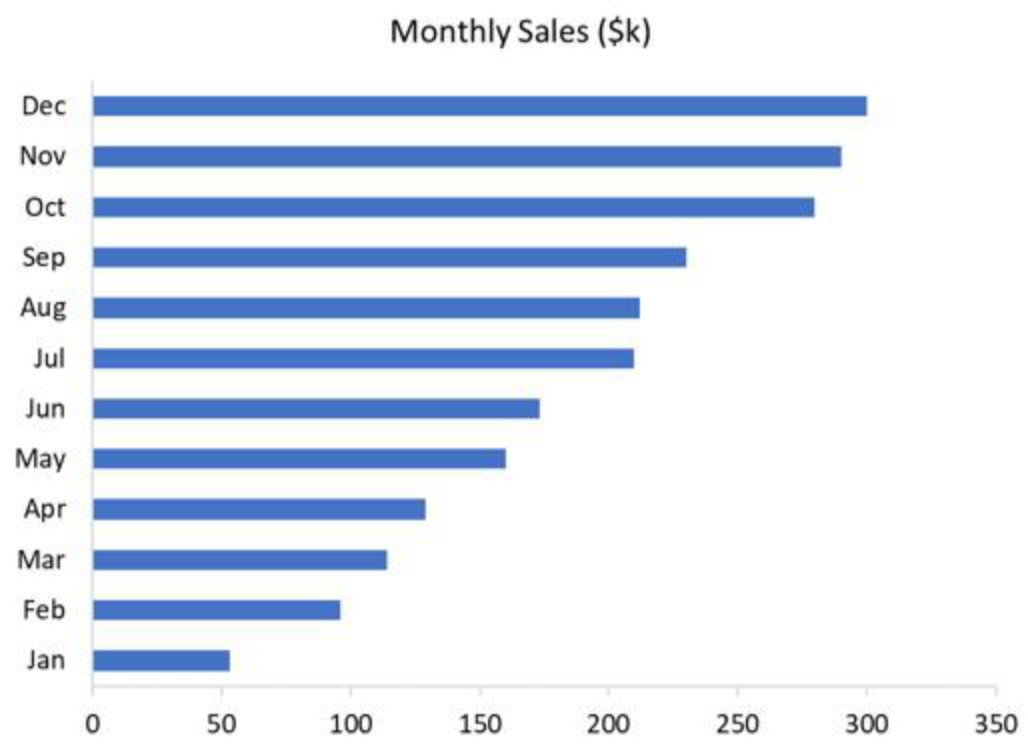 For the figure above, the ground-truth is:
```
x,299;289;279;229;211;209;173;159;128;113;95;53,horizontal_bar
y,Dec;Nov;Oct;Sep;Aug;Jul;Jun;May;Apr;Mar;Feb;Jan,horizontal_bar
```
#### Example - Histogram ####
Bar charts may also appear as **histograms**. In this case, the x labels occur at the ends of each bar and the x data series will have one more value than the y data series. Histograms are always of the vertical type.
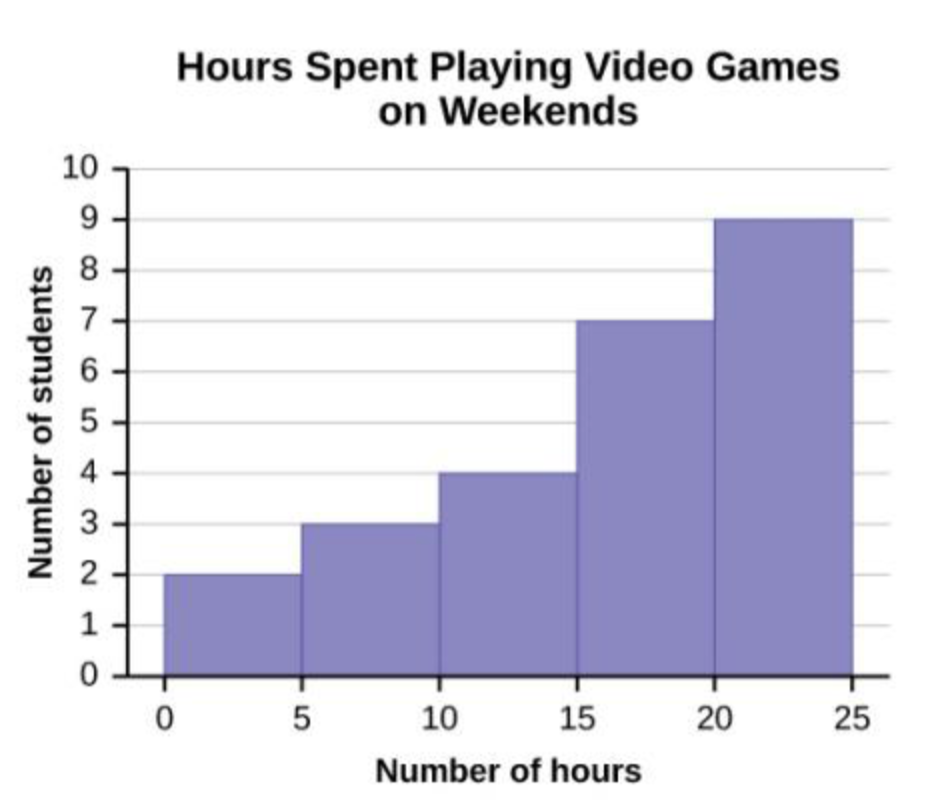 For the figure above, the ground-truth is:
```
x,0;5;10;15;20;25,vertical_bar
y,2.0;3.0;4.0;7.0;9.0,vertical_bar
```
Note that for the purposes of scoring, the x-axis values are treated as categorical type, not numeric.
### Dot ###
Dot plots have their independent values along the x-axis and their dependent values on the y-axis. The x-axis values will be numeric if the tick labels can be parsed as Python floats; otherwise, they are categorical:
```python
# Must be True for every value in the series
def is_numerical(x):
"""Test whether input can be parsed as a Python float."""
try:
float(x)
return True
except ValueError:
return False
```
The y-axis values are the number of dots in each column. The y-axis itself may or may not be present in the figure.
#### Example - Categorical X-Axis ####
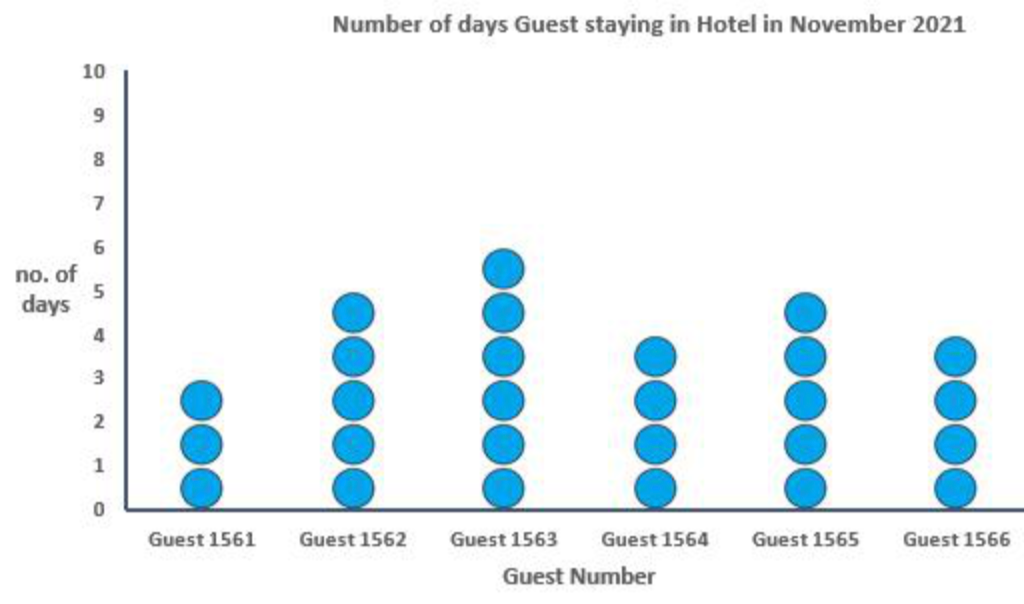 For the figure above, the ground-truth is:
```
x,Guest 1561;Guest 1562;Guest 1563;Guest 1564;Guest 1565;Guest 1566,dot
y,3;5;6;4;5;4,dot
```
#### Example - Numeric X-Axis ####
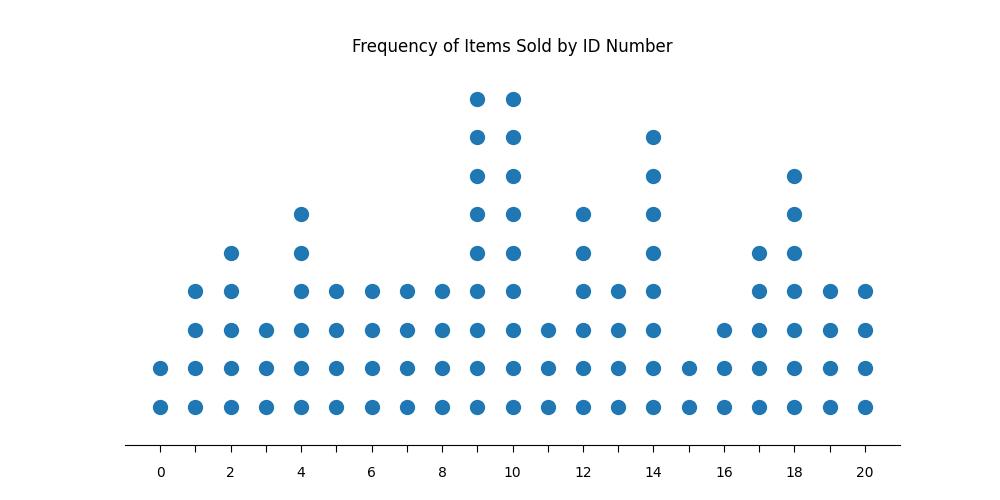 For the figure above, the ground-truth is:
```
x,0;1;2;3;4;5;6;7;8;9;10;11;12;13;14;15;16;17;18;19;20,dot
y,2;4;5;3;6;4;4;4;4;9;9;3;6;4;8;2;3;5;7;4;4,dot
```
### Line ###
Line graphs always have categorical x-axis values and numeric y-axis values. The values for the x-axis are the x-axis tick labels beneath some portion of the line graph. Tick labels not beneath some portion of the graph are not included in the series. The values for the y-axis are the corresponding dependent values indicated by the graph.
#### Example - Line Graph####
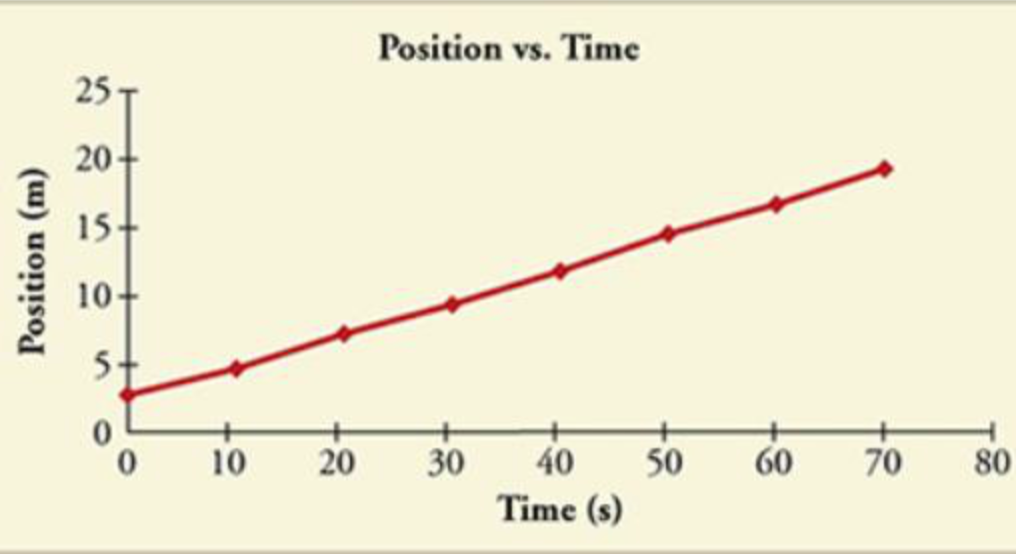 For the figure above, the ground-truth is:
```
x,0;10;20;30;40;50;60;70,line
y,2.85532;4.85973;7.02666;9.41515;11.72693;14.44788;16.70328;19.50852,line
```
For the purposes of scoring, the x-axis values are treated as categorical type, not numeric.
#### Example - Shared Origin Label ####
There is a special case when the two axes have a "shared origin" label. In order for an entry in the data series to be present, there must be an x-axis tick with a label and line data above it.
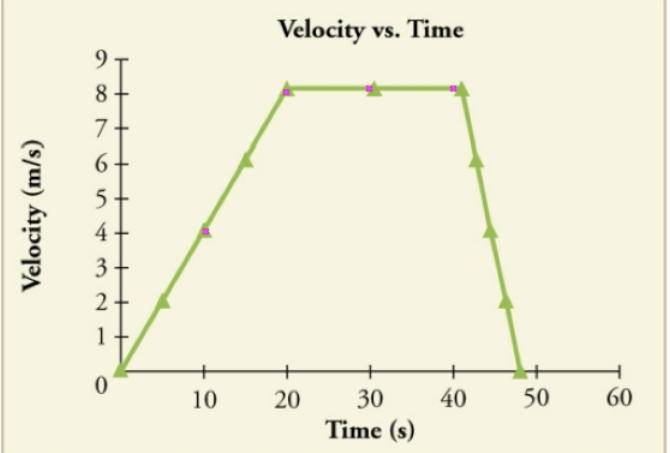 The data series for the figure above would not include the `0` values for either axis.
### Scatter ###
Scatter plots always have numeric x-axis values and numeric y-axis values. You should predict both x and y values for each point present in the figure. There may be multiple points with the same x- or y-coordinate.
#### Example ####
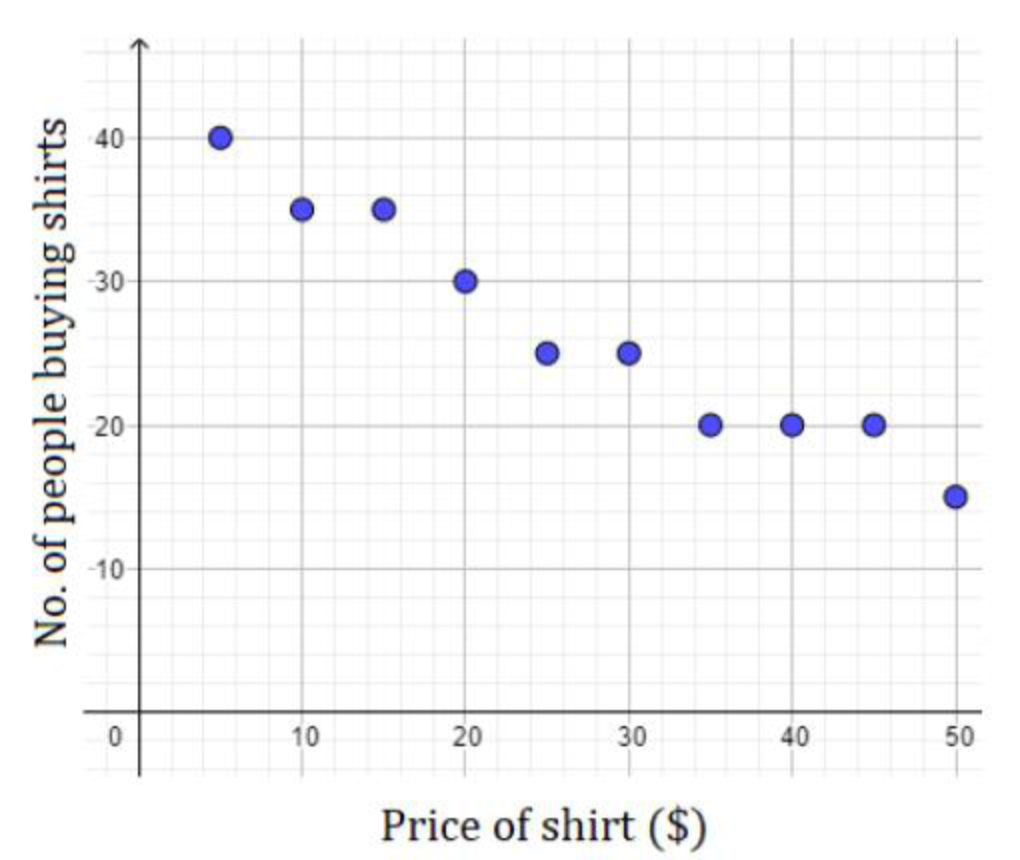 For the figure above, the ground-truth is:
```
x,5;10;15;20;25;30;35;40;45;50,scatter
y,40;35;35;30;25;25;20;20;20;15,scatter
```
### Other Notes and Conventions ###
For a numerical axis, a percentage like `X%` is labeled as the number `X` not `X/100`. For instance, `21.5%` is labeled as `21.5`, not as `0.215`.
With one exception, both series for a figure will have the same number of values. With histograms, the x-axis series has an additional value.
Occasionally, a figure may contain annotations with value labels. While you may use these values if you wish, note they may differ from ground-truth values, which are calculated based on the positioning of graphical elements on the page.
In the absence of an obvious corresponding tick / tick label pair, the center of the bounding box (in the case of vertical/horizontal labels) or the top corner of the bounding box (in the case of diagonal labels) should be used.