\n

Congratulations to all the prize/medal winners of the competition🎉🎉. It was a great opportunity to learn and grow.I would like to share my approach here.
\nMy approach to the problem involves two main steps: object detection and Optical Character Recognition(OCR).
\n
Object Detection(Yolov7-X):
\nI trained a yolov7 model to detect the x-axis labels, y-axis labels, the chart bounding box, and the data points on the chart. The coordinates of the data-points were not provided in the dataset. I was able to accurately compute the position of the datapoints on the chart images by linear interpolation of the x-axis and y-axis tick coordinates with respect to the x-axis/y-axis labels (values). Here is a notebook to create a dataset using this approach.
\n
\nDuring inference, I inverted this process by calulating the data-series from the linear interpolation of the values of x-axis and y-axis labels with respect to the co-ordinates of the data points.
This approach also works relatively well for scatter plots, compared to other approaches like Donut.
\nNotes:
\n
OCR model:
\nUsing the EasyOCR libary, I trained a ResNet(feature extractor)+BidirectionalLSTM model with Connectionist Temporal Classification(CTC) loss. The additional dataset(ICPR 2022 CHART) improved the accuracy of the OCR model by about 5% from 84% to 89%. I used this notebook as a starting point to train the OCR model (Thank you @nadhirhasan ).
Post processing:
\nAfter receiving the bounding boxes from the model, I performed some post-processing based on some simple heuristics like: removing the data points that lie outside the chart bbox, restricting x-labels(y-labels for horizontal-bar) to lie under the chart bbox, and restricting y-labels(x-labels for horizontal-bar) to the left side of the chart bbox. Also, the x/y axis tick coordinates are calculated using the x/y-axis bbox, and the chart bbox. I use the nearest point that lies on the chart bbox from the center of the x/y label bbox as the respective x/y tick coordinate. I chose this approach because the precision and recall of the x/y labels was higher than the x/y axis ticks in an older version of the model.
I participated in this competition only for the last 4 weeks. So, due to lack of time, I wasnt able to try out other approaches like Donut . I think there is a lot of room for improvement for this model. For example,about 25% of the predictions made by the model automatically get scored 0, because of mismatching number of predictions. This mismatch is due to only 1 or 2 points for charts besides scatter plot.
\nSubmission Notebook:
\nhttps://www.kaggle.com/code/samratthapa/20th-place-submission-yolov7-easyocr/notebook?scriptVersionId=134338733
For model checkpoints, and training scripts:
\nhttps://github.com/SamratThapa120/benetech-making-graphs-accessible
Congratulations to all the prize/medal winners of the competition🎉🎉. It was a great opportunity to learn and grow.I would like to share my approach here.
\nMy approach to the problem involves two main steps: object detection and Optical Character Recognition(OCR).
\n
Object Detection(Yolov7-X):
\nI trained a yolov7 model to detect the x-axis labels, y-axis labels, the chart bounding box, and the data points on the chart. The coordinates of the data-points were not provided in the dataset. I was able to accurately compute the position of the datapoints on the chart images by linear interpolation of the x-axis and y-axis tick coordinates with respect to the x-axis/y-axis labels (values). Here is a notebook to create a dataset using this approach.
\n
\nDuring inference, I inverted this process by calulating the data-series from the linear interpolation of the values of x-axis and y-axis labels with respect to the co-ordinates of the data points.
This approach also works relatively well for scatter plots, compared to other approaches like Donut.
\nNotes:
\nOCR model:
\nUsing the EasyOCR libary, I trained a ResNet(feature extractor)+BidirectionalLSTM model with Connectionist Temporal Classification(CTC) loss. The additional dataset(ICPR 2022 CHART) improved the accuracy of the OCR model by about 5% from 84% to 89%. I used this notebook as a starting point to train the OCR model (Thank you @nadhirhasan ).
Post processing:
\nAfter receiving the bounding boxes from the model, I performed some post-processing based on some simple heuristics like: removing the data points that lie outside the chart bbox, restricting x-labels(y-labels for horizontal-bar) to lie under the chart bbox, and restricting y-labels(x-labels for horizontal-bar) to the left side of the chart bbox. Also, the x/y axis tick coordinates are calculated using the x/y-axis bbox, and the chart bbox. I use the nearest point that lies on the chart bbox from the center of the x/y label bbox as the respective x/y tick coordinate. I chose this approach because the precision and recall of the x/y labels was higher than the x/y axis ticks in an older version of the model.
I participated in this competition only for the last 4 weeks. So, due to lack of time, I wasnt able to try out other approaches like Donut . I think there is a lot of room for improvement for this model. For example,about 25% of the predictions made by the model automatically get scored 0, because of mismatching number of predictions. This mismatch is due to only 1 or 2 points for charts besides scatter plot.
\nSubmission Notebook:
\nhttps://www.kaggle.com/code/samratthapa/20th-place-submission-yolov7-easyocr/notebook?scriptVersionId=134338733
For model checkpoints, and training scripts:
\nhttps://github.com/SamratThapa120/benetech-making-graphs-accessible
wow, super cool approach❤️.
", "rawMarkdown": "wow, super cool approach❤️.", "votes": null }, { "id": "2310479", "postDate": "06/20/2023 11:47:51", "content": "My approach is the same as yours
\nbut i use yolov5
\nmaybe my value deduction part is not good so the result is not high
\nthanks for sharing the code
Congrats on your silver!
\n\"There are overlapping bounding boxes for some x-axis labels like the image below. However, my OCR model was able to extract the correct text despite the input image including text from neighbour bboxes.\" -> Wow this is surprising! But it's impressive because you were able to teach EasyOCR to recognise rotated text.
\n\"Using the EasyOCR libary, I trained a ResNet(feature extractor)+BidirectionalLSTM model with Connectionist Temporal Classification(CTC) loss. The additional dataset(ICPR 2022 CHART) improved the accuracy of the OCR model by about 5% from 84% to 89%.\" -> I always thought TrOCR & PaddleOCR were superior to EasyOCR. Hence, we didn't try fine-tuning EasyOCR. I feel the 89% would have been higher had it not been for overlapping boxes.
", "rawMarkdown": "Congrats on your silver!\n\n*\"There are overlapping bounding boxes for some x-axis labels like the image below. However, my OCR model was able to extract the correct text despite the input image including text from neighbour bboxes.\"* -> Wow this is surprising! But it's impressive because you were able to teach EasyOCR to recognise rotated text.\n\n*\"Using the EasyOCR libary, I trained a ResNet(feature extractor)+BidirectionalLSTM model with Connectionist Temporal Classification(CTC) loss. The additional dataset(ICPR 2022 CHART) improved the accuracy of the OCR model by about 5% from 84% to 89%.\"* -> I always thought TrOCR & PaddleOCR were superior to EasyOCR. Hence, we didn't try fine-tuning EasyOCR. I feel the 89% would have been higher had it not been for overlapping boxes.", "votes": null }, { "id": "2313165", "postDate": "06/22/2023 13:45:05", "content": "THank you, Congratulations to you too.
\nThe ResNet feature extractor was able to handle rotated images too. In addition, I trained with rotation data augmentations along with other affine transforms, blurring, ColorJitter,. I tried to use VGG instead of ResNet , but it was not working so well.
Before training with overlapping bounding boxes, I was trying to use a segmentation model to extract the x/y labels, but there were a lot of false negatives. On the other hand, my bbox detection model was working well, so I decided to stick with it, and train an OCR adaped to the bbox detection model. Surprisingly, the OCR worked better than I has anticipated even with the overlapping bboxes .
", "rawMarkdown": "THank you, Congratulations to you too.\nThe ResNet feature extractor was able to handle rotated images too. In addition, I trained with rotation data augmentations along with other affine transforms, blurring, ColorJitter,. I tried to use VGG instead of ResNet , but it was not working so well. \n\nBefore training with overlapping bounding boxes, I was trying to use a segmentation model to extract the x/y labels, but there were a lot of false negatives. On the other hand, my bbox detection model was working well, so I decided to stick with it, and train an OCR adaped to the bbox detection model. Surprisingly, the OCR worked better than I has anticipated even with the overlapping bboxes .", "votes": null }, { "id": "2313189", "postDate": "06/22/2023 14:14:33", "content": "Interesting.
", "rawMarkdown": "Interesting.", "votes": null }, { "id": "2317191", "postDate": "06/25/2023 13:56:23", "content": "may I know why did you use v5 instead?
", "rawMarkdown": "may I know why did you use v5 instead?", "votes": null }, { "id": "2317807", "postDate": "06/26/2023 02:21:13", "content": "I use yolov5 because yolov5 faster training than yolov7. When I found out about this competition there were only 2 weeks left
", "rawMarkdown": "I use yolov5 because yolov5 faster training than yolov7. When I found out about this competition there were only 2 weeks left", "votes": null } ], "comments": [ { "id": 2310455, "author_name": "nadhirhasan", "author_url": "", "post_date": "06/20/2023 11:20:01", "content": "wow, super cool approach❤️.
", "votes": null, "replies": [] }, { "id": 2310479, "author_name": "thangnm1", "author_url": "", "post_date": "06/20/2023 11:47:51", "content": "My approach is the same as yours
\nbut i use yolov5
\nmaybe my value deduction part is not good so the result is not high
\nthanks for sharing the code
may I know why did you use v5 instead?
", "votes": null, "replies": [ { "id": 2317807, "author_name": "thangnm1", "author_url": "", "post_date": "06/26/2023 02:21:13", "content": "I use yolov5 because yolov5 faster training than yolov7. When I found out about this competition there were only 2 weeks left
", "votes": null, "replies": [] } ] } ] }, { "id": 2313145, "author_name": "sambitmukherjee", "author_url": "", "post_date": "06/22/2023 13:15:45", "content": "Congrats on your silver!
\n\"There are overlapping bounding boxes for some x-axis labels like the image below. However, my OCR model was able to extract the correct text despite the input image including text from neighbour bboxes.\" -> Wow this is surprising! But it's impressive because you were able to teach EasyOCR to recognise rotated text.
\n\"Using the EasyOCR libary, I trained a ResNet(feature extractor)+BidirectionalLSTM model with Connectionist Temporal Classification(CTC) loss. The additional dataset(ICPR 2022 CHART) improved the accuracy of the OCR model by about 5% from 84% to 89%.\" -> I always thought TrOCR & PaddleOCR were superior to EasyOCR. Hence, we didn't try fine-tuning EasyOCR. I feel the 89% would have been higher had it not been for overlapping boxes.
", "votes": null, "replies": [ { "id": 2313165, "author_name": "samratthapa", "author_url": "", "post_date": "06/22/2023 13:45:05", "content": "THank you, Congratulations to you too.
\nThe ResNet feature extractor was able to handle rotated images too. In addition, I trained with rotation data augmentations along with other affine transforms, blurring, ColorJitter,. I tried to use VGG instead of ResNet , but it was not working so well.
Before training with overlapping bounding boxes, I was trying to use a segmentation model to extract the x/y labels, but there were a lot of false negatives. On the other hand, my bbox detection model was working well, so I decided to stick with it, and train an OCR adaped to the bbox detection model. Surprisingly, the OCR worked better than I has anticipated even with the overlapping bboxes .
", "votes": null, "replies": [ { "id": 2313189, "author_name": "sambitmukherjee", "author_url": "", "post_date": "06/22/2023 14:14:33", "content": "Interesting.
", "votes": null, "replies": [] } ] } ] } ], "raw_markdown_by_id": { "2310386": "Congratulations to all the prize/medal winners of the competition🎉🎉. It was a great opportunity to learn and grow.I would like to share my approach here.\n \nMy approach to the problem involves two main steps: object detection and Optical Character Recognition(OCR).\n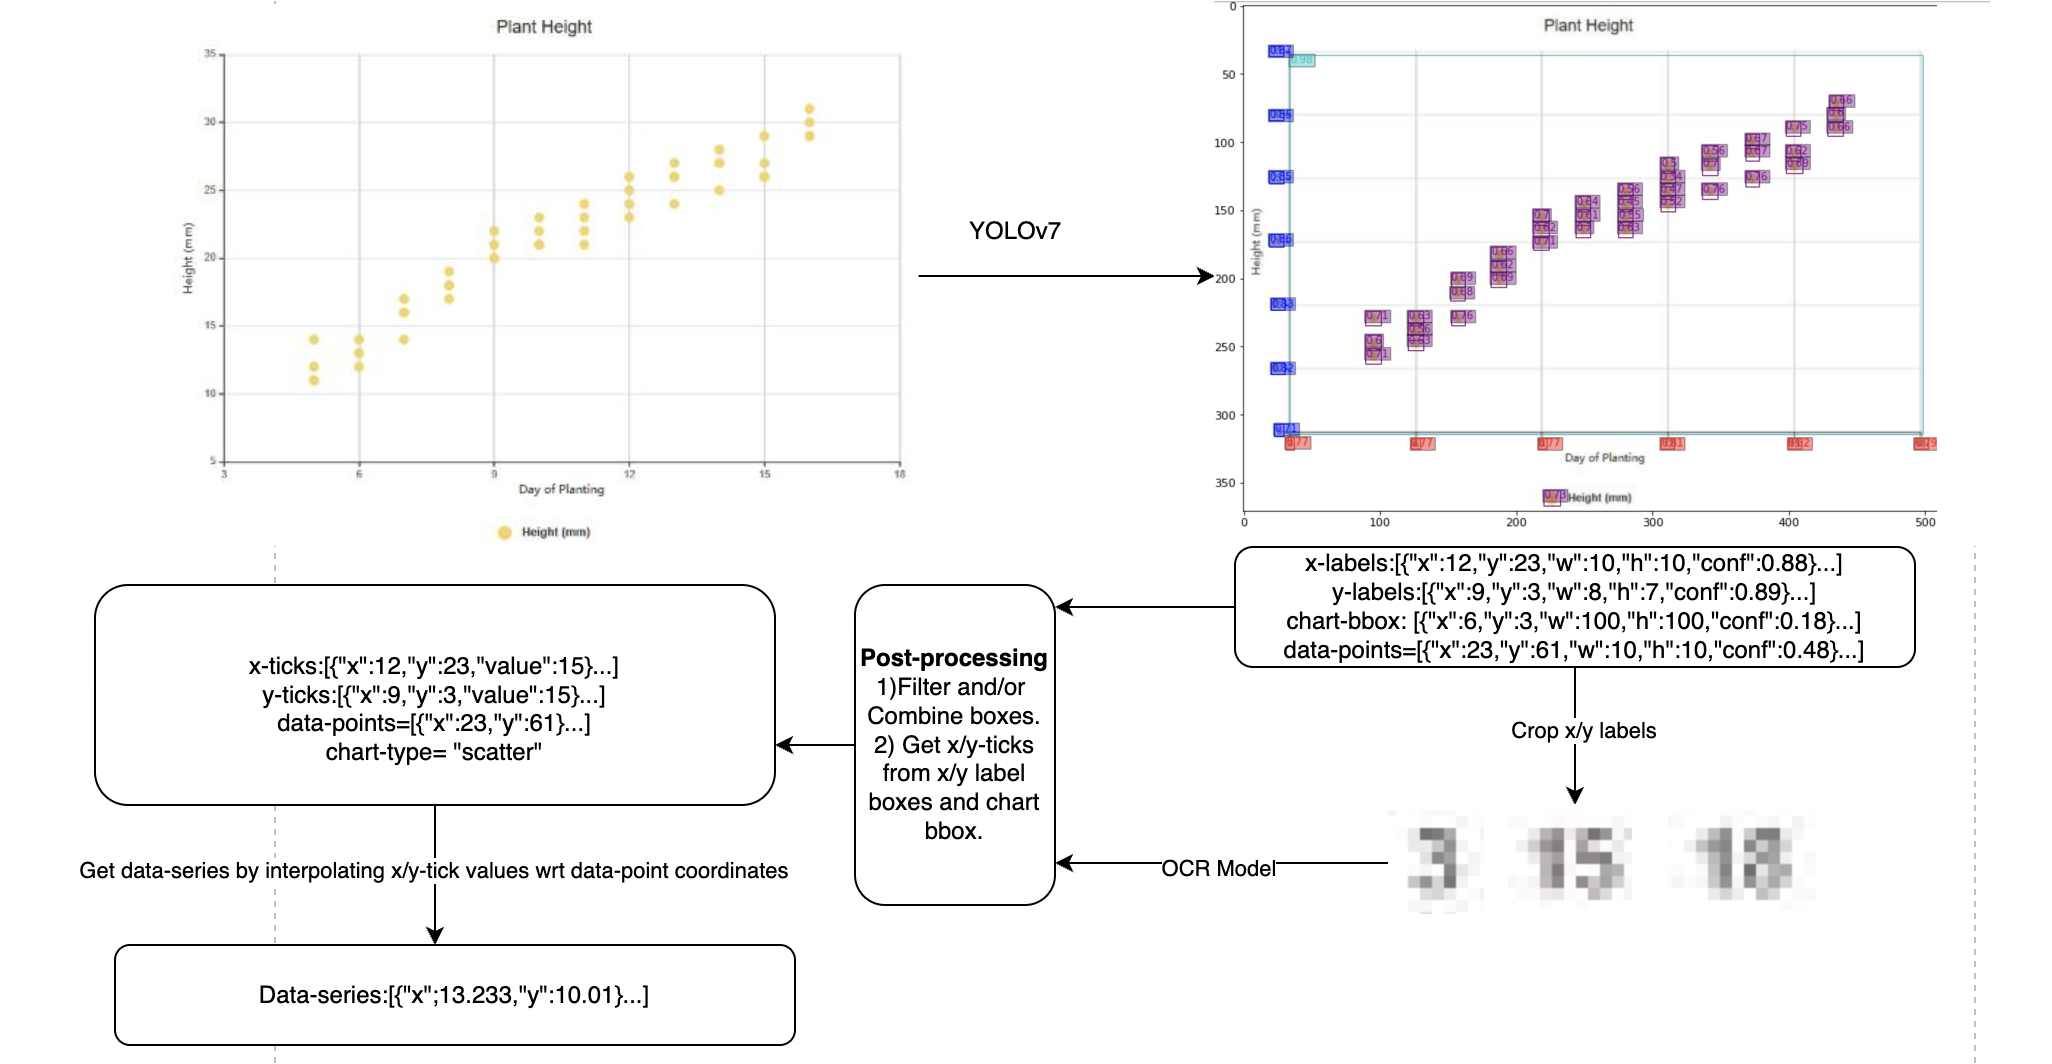\n\n**Object Detection(Yolov7-X):**\nI trained a yolov7 model to detect the x-axis labels, y-axis labels, the chart bounding box, and the data points on the chart. The coordinates of the data-points were not provided in the dataset. I was able to accurately compute the position of the datapoints on the chart images by linear interpolation of the x-axis and y-axis tick coordinates with respect to the x-axis/y-axis labels (values). [Here](https://www.kaggle.com/samratthapa/data-prep-for-yolov7-data-point-x-y-label-chart) is a notebook to create a dataset using this approach. \n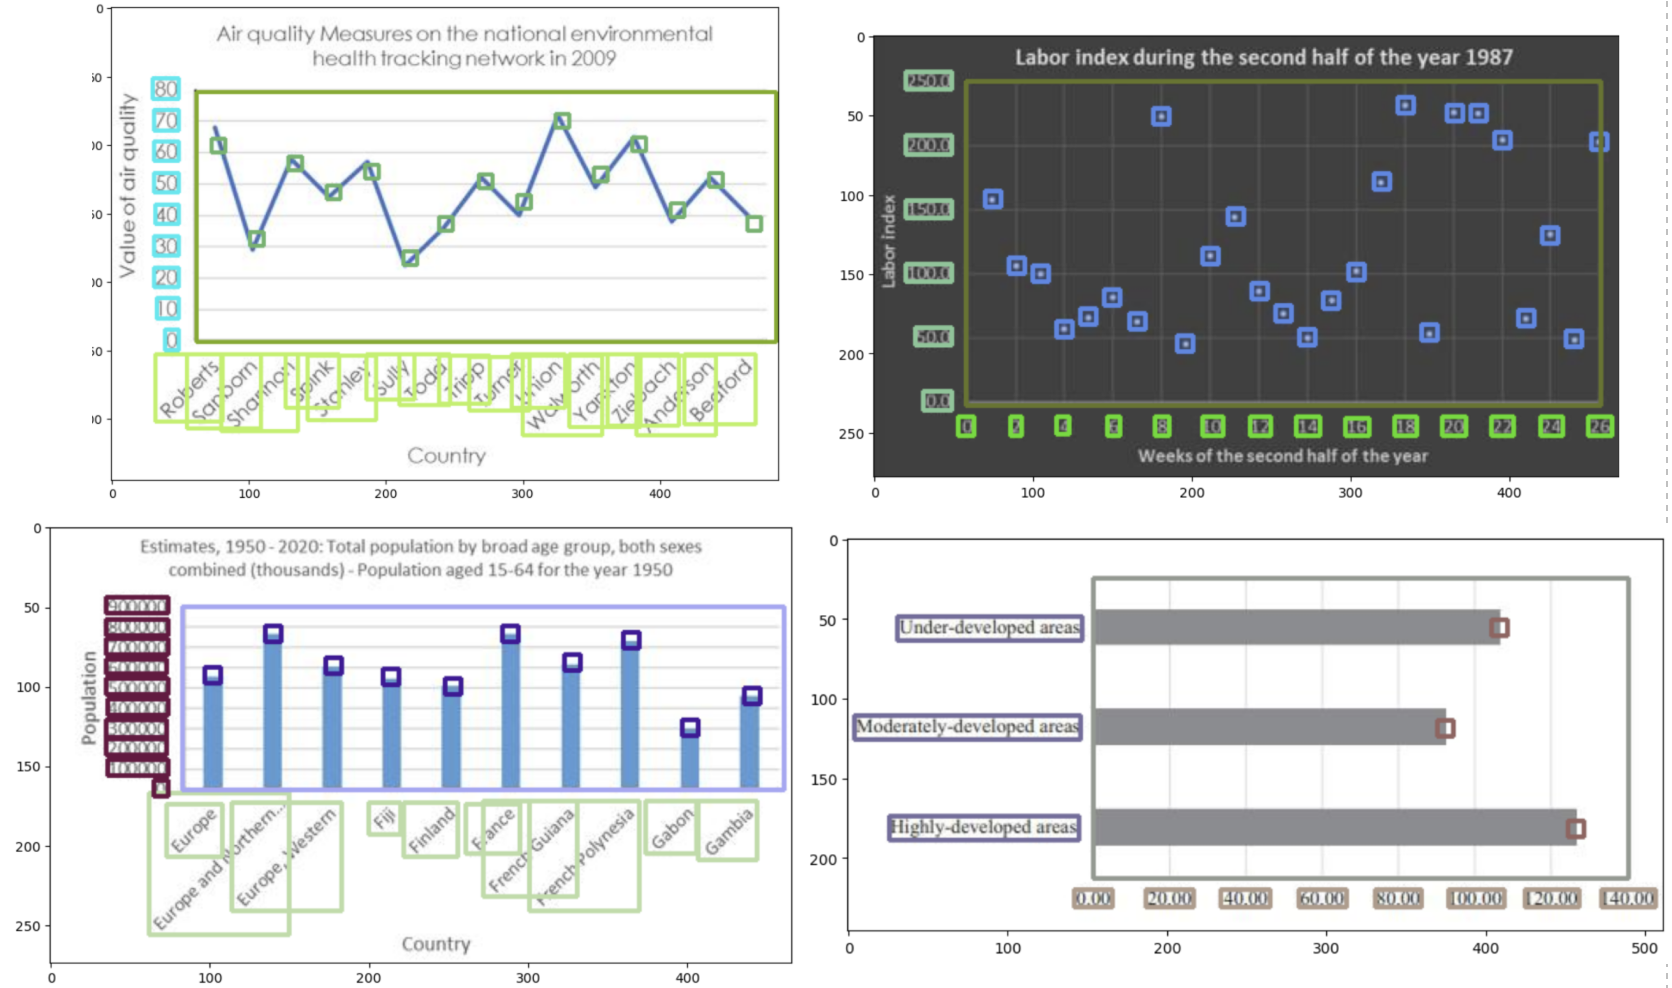\nDuring inference, I inverted this process by calulating the data-series from the linear interpolation of the values of x-axis and y-axis labels with respect to the co-ordinates of the data points.\n\nThis approach also works relatively well for scatter plots, compared to other approaches like Donut.\n\nNotes:\n\n- This object detection model was also used as the chart-type classification model.\n- There are overlapping bounxing boxes for some x-axis labels like the image below. However, my OCR model was able to extract the correct text despite the input image including text from neighbour bboxes.\n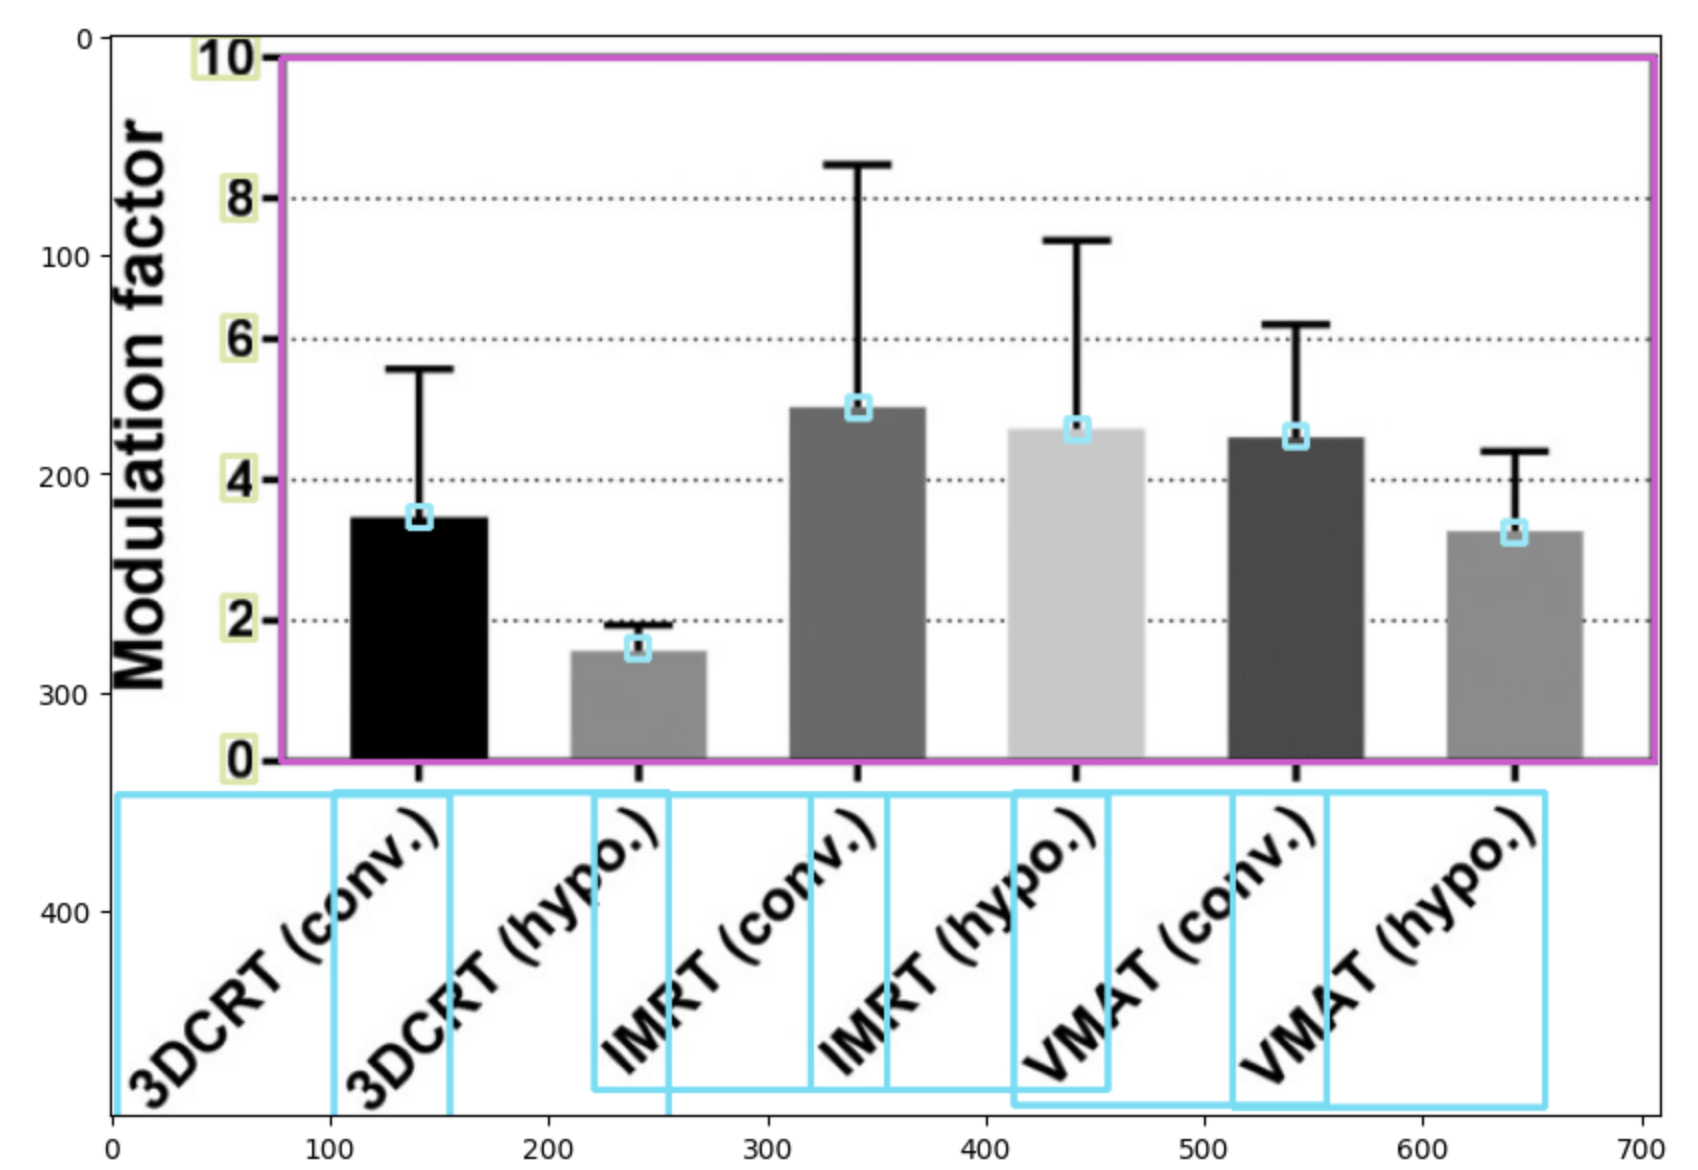\n\n\n\n**OCR model:**\nUsing the EasyOCR libary, I trained a ResNet(feature extractor)+BidirectionalLSTM model with Connectionist Temporal Classification(CTC) loss. The additional dataset(ICPR 2022 CHART) improved the accuracy of the OCR model by about 5% from 84% to 89%. I used [this notebook ](https://www.kaggle.com/code/nadhirhasan/let-s-finetune-easyocr-boom)as a starting point to train the OCR model (Thank you @nadhirhasan ).\n\n**Post processing:**\nAfter receiving the bounding boxes from the model, I performed some post-processing based on some simple heuristics like: removing the data points that lie outside the chart bbox, restricting x-labels(y-labels for horizontal-bar) to lie under the chart bbox, and restricting y-labels(x-labels for horizontal-bar) to the left side of the chart bbox. Also, the x/y axis tick coordinates are calculated using the x/y-axis bbox, and the chart bbox. I use the nearest point that lies on the chart bbox from the center of the x/y label bbox as the respective x/y tick coordinate. I chose this approach because the precision and recall of the x/y labels was higher than the x/y axis ticks in an older version of the model.\n\n\nI participated in this competition only for the last 4 weeks. So, due to lack of time, I wasnt able to try out other approaches like Donut . I think there is a lot of room for improvement for this model. For example,about 25% of the predictions made by the model automatically get scored 0, because of mismatching number of predictions. This mismatch is due to only 1 or 2 points for charts besides scatter plot.\n\nSubmission Notebook:\nhttps://www.kaggle.com/code/samratthapa/20th-place-submission-yolov7-easyocr/notebook?scriptVersionId=134338733\n\nFor model checkpoints, and training scripts: \nhttps://github.com/SamratThapa120/benetech-making-graphs-accessible", "2310455": "wow, super cool approach❤️.", "2310479": "My approach is the same as yours\nbut i use yolov5\nmaybe my value deduction part is not good so the result is not high\nthanks for sharing the code", "2313145": "Congrats on your silver!\n\n*\"There are overlapping bounding boxes for some x-axis labels like the image below. However, my OCR model was able to extract the correct text despite the input image including text from neighbour bboxes.\"* -> Wow this is surprising! But it's impressive because you were able to teach EasyOCR to recognise rotated text.\n\n*\"Using the EasyOCR libary, I trained a ResNet(feature extractor)+BidirectionalLSTM model with Connectionist Temporal Classification(CTC) loss. The additional dataset(ICPR 2022 CHART) improved the accuracy of the OCR model by about 5% from 84% to 89%.\"* -> I always thought TrOCR & PaddleOCR were superior to EasyOCR. Hence, we didn't try fine-tuning EasyOCR. I feel the 89% would have been higher had it not been for overlapping boxes.", "2313165": "THank you, Congratulations to you too.\nThe ResNet feature extractor was able to handle rotated images too. In addition, I trained with rotation data augmentations along with other affine transforms, blurring, ColorJitter,. I tried to use VGG instead of ResNet , but it was not working so well. \n\nBefore training with overlapping bounding boxes, I was trying to use a segmentation model to extract the x/y labels, but there were a lot of false negatives. On the other hand, my bbox detection model was working well, so I decided to stick with it, and train an OCR adaped to the bbox detection model. Surprisingly, the OCR worked better than I has anticipated even with the overlapping bboxes .", "2313189": "Interesting.", "2317191": "may I know why did you use v5 instead?", "2317807": "I use yolov5 because yolov5 faster training than yolov7. When I found out about this competition there were only 2 weeks left" }, "source": "meta" }