{
  "id": 418604,
  "title": "4th place solution",
  "url": "/competitions/benetech-making-graphs-accessible/writeups/monnu-someya-4th-place-solution",
  "author_name": "",
  "post_date": "2023-06-22T09:36:36.320Z",
  "votes": 21,
  "comment_count": 5,
  "views": 0,
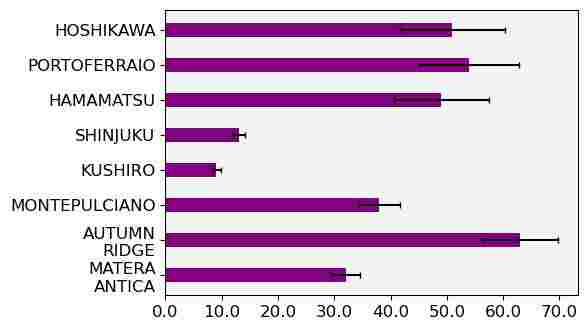
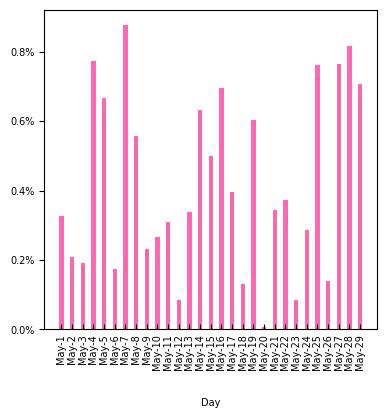
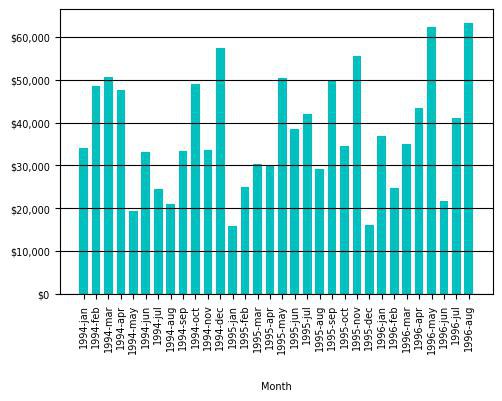
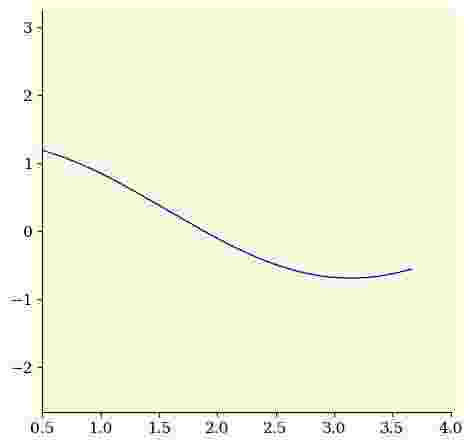
  "content": "<p>Congratulations to all the winners and thanks to the organizers for hosting this interesting competition.<br>\nI would also like to thank my teammate <a href=\"https://www.kaggle.com/fuumin621\" target=\"_blank\">@fuumin621</a> for working with me on this challenging task.</p>\n<h1>SUMMARY</h1>\n<p>Similar to other solutions, our pipeline also consists of object detection for scatter points and end-to-end plot prediction by deplot for other graphs.<br>\n<strong>Scatter plots</strong>: plot-bb detection with YOLOX + scatter point detection with YOLOX + OCR of max/min axis labels with matcha<br>\n<strong>Other graphs</strong>: deplot trained with original synthetic data</p>\n<h1>Scatter point detection</h1>\n<p>We used the following two steps object detection to detect scatter points and determined the coordinates of scatter points from the axis labels read by matcha.</p>\n<p>Step 1. plot-bb detection by YOLOX (model size : x, image size : 640)<br>\nStep 2. scatter points detection with \"plot-bb cropped\" image by YOLOX (model size : x, image size : 960)</p>\n<p>Training data for step.2 is the competition data (generated, extracted)+ 538 scatter plots from ICDAR dataset.</p>\n<p>Public LB : Private LB = 0.09 : 0.29</p>\n<h1>Bar graph, line graph, dot graph</h1>\n<p>We used a variety of graph data sources for training deplot,</p>\n<ol>\n<li>generated graph (competition data)</li>\n<li>extracted graph (competition data)</li>\n<li>ICDAR dataset (1185 single series + 2992 multiple series)</li>\n<li><a href=\"https://www.kaggle.com/brendanartley\" target=\"_blank\">@brendanartley</a> 's 500k dataset (except scatter)</li>\n<li>original synthetic dataset (vertical bar: 40000, horizontal bar: 40000, line: 40000)</li>\n<li>original synthetic dataset (histogram : 10000)</li>\n</ol>\n<h2>original dataset (generated by matplotlib)</h2>\n<p>Our key focus of this competition is data generation.<br>\nWe generated graphs with various patterns to make our model robust against unknown private dataset.<br>\nThe generated graphs were evaluated using the competition dataset (extracted) and the ICDAR dataset.<br>\nContinuous graph modification and feedback from error analysis allowed predictions to be made on difficult data.<br>\nOur data was especially helpful in improving the accuracy of line graphs (so it is very important whether the line is on the tick label or not!).</p>\n<p>Some attempts for improving common mistakes:</p>\n<ul>\n<li>line plot with no value on some tick labels</li>\n<li>JPG compression to lower quality (simulate low resolution and blurred characters)</li>\n<li>add symbols ($ % , .) to distinguish numbers and symbols (like 8 and $)</li>\n<li>extended predicted digits for small values (like &lt; 0.0001)</li>\n<li>separate labels into multiple lines</li>\n<li>etc..</li>\n</ul>\n<p>Some examples of our generated graphs are shown below.</p>\n<p><img src=\"https://www.googleapis.com/download/storage/v1/b/kaggle-forum-message-attachments/o/inbox%2F6102861%2F8e95529288fbfda2462e21336fb43b5b%2F00000008.jpeg?generation=1687351996558599&amp;alt=media\" alt=\"\"></p>\n<p><img src=\"https://www.googleapis.com/download/storage/v1/b/kaggle-forum-message-attachments/o/inbox%2F6102861%2F392cab76953662bed1d6fc6f17be4e59%2F00000054.jpeg?generation=1687352984294446&amp;alt=media\" alt=\"\"></p>\n<p><img src=\"https://www.googleapis.com/download/storage/v1/b/kaggle-forum-message-attachments/o/inbox%2F6102861%2F2dfff51c40cb57f1793b4c56fbea2560%2F00000042.jpeg?generation=1687353205159183&amp;alt=media\" alt=\"\"></p>\n<p><img src=\"https://www.googleapis.com/download/storage/v1/b/kaggle-forum-message-attachments/o/inbox%2F6102861%2F584b0585fa82beffd0d3cd771c347bd3%2F00000081.jpeg?generation=1687357868152994&amp;alt=media\" alt=\"\"></p>\n<h2>Training (deplot)</h2>\n<h3>training data configuration</h3>\n<table>\n<thead>\n<tr>\n<th>source</th>\n<th># of samples per epoch</th>\n<th>total graphs</th>\n</tr>\n</thead>\n<tbody>\n<tr>\n<td>generated</td>\n<td>1000</td>\n<td>50000</td>\n</tr>\n<tr>\n<td>extracted</td>\n<td>953</td>\n<td>953</td>\n</tr>\n<tr>\n<td>ICDAR</td>\n<td>1000</td>\n<td>4177</td>\n</tr>\n<tr>\n<td>500k dataset</td>\n<td>1000</td>\n<td>400000</td>\n</tr>\n<tr>\n<td>original synthetic data</td>\n<td>2000</td>\n<td>120000</td>\n</tr>\n<tr>\n<td>original synthetic data (histogram)</td>\n<td>100</td>\n<td>10000</td>\n</tr>\n</tbody>\n</table>\n<p>For each epoch, we randomly sampled the graphs for each source at the above ratios.</p>\n<h3>training conditions</h3>\n<p>epochs: 50<br>\nlearning rate: 2e-4<br>\nscheduler: cosine annealing<br>\nbatch (accumulation): 64</p>\n<h1>Final results</h1>\n<table>\n<thead>\n<tr>\n<th>chart-type</th>\n<th>Public LB</th>\n<th>Private LB</th>\n</tr>\n</thead>\n<tbody>\n<tr>\n<td>all</td>\n<td>0.86</td>\n<td>0.69</td>\n</tr>\n<tr>\n<td>vertical bar</td>\n<td>0.39</td>\n<td>0.26</td>\n</tr>\n<tr>\n<td>horizontal bar</td>\n<td>0.04</td>\n<td>0.01</td>\n</tr>\n<tr>\n<td>line</td>\n<td>0.32</td>\n<td>0.12</td>\n</tr>\n<tr>\n<td>scatter</td>\n<td>0.09</td>\n<td>0.29</td>\n</tr>\n<tr>\n<td>dot</td>\n<td>0</td>\n<td>0</td>\n</tr>\n</tbody>\n</table>",
  "messages": [
    {
      "id": "2311921",
      "postDate": "06/21/2023 14:32:14",
      "content": "<p>Congratulations to all the winners and thanks to the organizers for hosting this interesting competition.<br>\nI would also like to thank my teammate <a href=\"https://www.kaggle.com/fuumin621\" target=\"_blank\">@fuumin621</a> for working with me on this challenging task.</p>\n<h1>SUMMARY</h1>\n<p>Similar to other solutions, our pipeline also consists of object detection for scatter points and end-to-end plot prediction by deplot for other graphs.<br>\n<strong>Scatter plots</strong>: plot-bb detection with YOLOX + scatter point detection with YOLOX + OCR of max/min axis labels with matcha<br>\n<strong>Other graphs</strong>: deplot trained with original synthetic data</p>\n<h1>Scatter point detection</h1>\n<p>We used the following two steps object detection to detect scatter points and determined the coordinates of scatter points from the axis labels read by matcha.</p>\n<p>Step 1. plot-bb detection by YOLOX (model size : x, image size : 640)<br>\nStep 2. scatter points detection with \"plot-bb cropped\" image by YOLOX (model size : x, image size : 960)</p>\n<p>Training data for step.2 is the competition data (generated, extracted)+ 538 scatter plots from ICDAR dataset.</p>\n<p>Public LB : Private LB = 0.09 : 0.29</p>\n<h1>Bar graph, line graph, dot graph</h1>\n<p>We used a variety of graph data sources for training deplot,</p>\n<ol>\n<li>generated graph (competition data)</li>\n<li>extracted graph (competition data)</li>\n<li>ICDAR dataset (1185 single series + 2992 multiple series)</li>\n<li><a href=\"https://www.kaggle.com/brendanartley\" target=\"_blank\">@brendanartley</a> 's 500k dataset (except scatter)</li>\n<li>original synthetic dataset (vertical bar: 40000, horizontal bar: 40000, line: 40000)</li>\n<li>original synthetic dataset (histogram : 10000)</li>\n</ol>\n<h2>original dataset (generated by matplotlib)</h2>\n<p>Our key focus of this competition is data generation.<br>\nWe generated graphs with various patterns to make our model robust against unknown private dataset.<br>\nThe generated graphs were evaluated using the competition dataset (extracted) and the ICDAR dataset.<br>\nContinuous graph modification and feedback from error analysis allowed predictions to be made on difficult data.<br>\nOur data was especially helpful in improving the accuracy of line graphs (so it is very important whether the line is on the tick label or not!).</p>\n<p>Some attempts for improving common mistakes:</p>\n<ul>\n<li>line plot with no value on some tick labels</li>\n<li>JPG compression to lower quality (simulate low resolution and blurred characters)</li>\n<li>add symbols ($ % , .) to distinguish numbers and symbols (like 8 and $)</li>\n<li>extended predicted digits for small values (like &lt; 0.0001)</li>\n<li>separate labels into multiple lines</li>\n<li>etc..</li>\n</ul>\n<p>Some examples of our generated graphs are shown below.</p>\n<p><img src=\"https://www.googleapis.com/download/storage/v1/b/kaggle-forum-message-attachments/o/inbox%2F6102861%2F8e95529288fbfda2462e21336fb43b5b%2F00000008.jpeg?generation=1687351996558599&amp;alt=media\" alt=\"\"></p>\n<p><img src=\"https://www.googleapis.com/download/storage/v1/b/kaggle-forum-message-attachments/o/inbox%2F6102861%2F392cab76953662bed1d6fc6f17be4e59%2F00000054.jpeg?generation=1687352984294446&amp;alt=media\" alt=\"\"></p>\n<p><img src=\"https://www.googleapis.com/download/storage/v1/b/kaggle-forum-message-attachments/o/inbox%2F6102861%2F2dfff51c40cb57f1793b4c56fbea2560%2F00000042.jpeg?generation=1687353205159183&amp;alt=media\" alt=\"\"></p>\n<p><img src=\"https://www.googleapis.com/download/storage/v1/b/kaggle-forum-message-attachments/o/inbox%2F6102861%2F584b0585fa82beffd0d3cd771c347bd3%2F00000081.jpeg?generation=1687357868152994&amp;alt=media\" alt=\"\"></p>\n<h2>Training (deplot)</h2>\n<h3>training data configuration</h3>\n<table>\n<thead>\n<tr>\n<th>source</th>\n<th># of samples per epoch</th>\n<th>total graphs</th>\n</tr>\n</thead>\n<tbody>\n<tr>\n<td>generated</td>\n<td>1000</td>\n<td>50000</td>\n</tr>\n<tr>\n<td>extracted</td>\n<td>953</td>\n<td>953</td>\n</tr>\n<tr>\n<td>ICDAR</td>\n<td>1000</td>\n<td>4177</td>\n</tr>\n<tr>\n<td>500k dataset</td>\n<td>1000</td>\n<td>400000</td>\n</tr>\n<tr>\n<td>original synthetic data</td>\n<td>2000</td>\n<td>120000</td>\n</tr>\n<tr>\n<td>original synthetic data (histogram)</td>\n<td>100</td>\n<td>10000</td>\n</tr>\n</tbody>\n</table>\n<p>For each epoch, we randomly sampled the graphs for each source at the above ratios.</p>\n<h3>training conditions</h3>\n<p>epochs: 50<br>\nlearning rate: 2e-4<br>\nscheduler: cosine annealing<br>\nbatch (accumulation): 64</p>\n<h1>Final results</h1>\n<table>\n<thead>\n<tr>\n<th>chart-type</th>\n<th>Public LB</th>\n<th>Private LB</th>\n</tr>\n</thead>\n<tbody>\n<tr>\n<td>all</td>\n<td>0.86</td>\n<td>0.69</td>\n</tr>\n<tr>\n<td>vertical bar</td>\n<td>0.39</td>\n<td>0.26</td>\n</tr>\n<tr>\n<td>horizontal bar</td>\n<td>0.04</td>\n<td>0.01</td>\n</tr>\n<tr>\n<td>line</td>\n<td>0.32</td>\n<td>0.12</td>\n</tr>\n<tr>\n<td>scatter</td>\n<td>0.09</td>\n<td>0.29</td>\n</tr>\n<tr>\n<td>dot</td>\n<td>0</td>\n<td>0</td>\n</tr>\n</tbody>\n</table>",
      "rawMarkdown": "Congratulations to all the winners and thanks to the organizers for hosting this interesting competition.\nI would also like to thank my teammate @fuumin621 for working with me on this challenging task.\n\n# SUMMARY\nSimilar to other solutions, our pipeline also consists of object detection for scatter points and end-to-end plot prediction by deplot for other graphs.\n**Scatter plots**: plot-bb detection with YOLOX + scatter point detection with YOLOX + OCR of max/min axis labels with matcha\n**Other graphs**: deplot trained with original synthetic data\n\n# Scatter point detection\nWe used the following two steps object detection to detect scatter points and determined the coordinates of scatter points from the axis labels read by matcha.\n\nStep 1. plot-bb detection by YOLOX (model size : x, image size : 640)\nStep 2. scatter points detection with \"plot-bb cropped\" image by YOLOX (model size : x, image size : 960)\n\nTraining data for step.2 is the competition data (generated, extracted)+ 538 scatter plots from ICDAR dataset.\n\nPublic LB : Private LB = 0.09 : 0.29\n\n# Bar graph, line graph, dot graph\n\nWe used a variety of graph data sources for training deplot,\n\n1. generated graph (competition data)\n2. extracted graph (competition data)\n3. ICDAR dataset (1185 single series + 2992 multiple series)\n4. @brendanartley 's 500k dataset (except scatter)\n5. original synthetic dataset (vertical bar: 40000, horizontal bar: 40000, line: 40000)\n6. original synthetic dataset (histogram : 10000)\n\n## original dataset (generated by matplotlib)\nOur key focus of this competition is data generation.\nWe generated graphs with various patterns to make our model robust against unknown private dataset.\nThe generated graphs were evaluated using the competition dataset (extracted) and the ICDAR dataset.\nContinuous graph modification and feedback from error analysis allowed predictions to be made on difficult data.\nOur data was especially helpful in improving the accuracy of line graphs (so it is very important whether the line is on the tick label or not!).\n\nSome attempts for improving common mistakes:\n- line plot with no value on some tick labels\n- JPG compression to lower quality (simulate low resolution and blurred characters)\n- add symbols ($ % , .) to distinguish numbers and symbols (like 8 and $)\n- extended predicted digits for small values (like < 0.0001)\n- separate labels into multiple lines\n- etc..\n\nSome examples of our generated graphs are shown below.\n\n![](https://www.googleapis.com/download/storage/v1/b/kaggle-forum-message-attachments/o/inbox%2F6102861%2F8e95529288fbfda2462e21336fb43b5b%2F00000008.jpeg?generation=1687351996558599&alt=media)\n\n![](https://www.googleapis.com/download/storage/v1/b/kaggle-forum-message-attachments/o/inbox%2F6102861%2F392cab76953662bed1d6fc6f17be4e59%2F00000054.jpeg?generation=1687352984294446&alt=media)\n\n![](https://www.googleapis.com/download/storage/v1/b/kaggle-forum-message-attachments/o/inbox%2F6102861%2F2dfff51c40cb57f1793b4c56fbea2560%2F00000042.jpeg?generation=1687353205159183&alt=media)\n\n![](https://www.googleapis.com/download/storage/v1/b/kaggle-forum-message-attachments/o/inbox%2F6102861%2F584b0585fa82beffd0d3cd771c347bd3%2F00000081.jpeg?generation=1687357868152994&alt=media)\n\n## Training (deplot)\n### training data configuration\n| source | # of samples per epoch | total graphs |\n| --- | --- |\n| generated | 1000| 50000 |\n| extracted | 953 | 953 |\n| ICDAR | 1000 | 4177 |\n| 500k dataset | 1000 | 400000 |\n| original synthetic data | 2000 | 120000 | \n| original synthetic data (histogram) | 100 | 10000 | \n\nFor each epoch, we randomly sampled the graphs for each source at the above ratios.\n\n### training conditions\nepochs: 50\nlearning rate: 2e-4\nscheduler: cosine annealing\nbatch (accumulation): 64\n\n# Final results\n\n| chart-type | Public LB | Private LB |\n| --- | --- |\n| all | 0.86| 0.69 |\n| vertical bar | 0.39 | 0.26 |\n| horizontal bar | 0.04 | 0.01 |\n| line | 0.32 | 0.12 |\n| scatter | 0.09| 0.29 |\n| dot | 0 | 0 |",
      "votes": null
    },
    {
      "id": "2312308",
      "postDate": "06/21/2023 19:53:09",
      "content": "<p>Thanks you so much for sharing <a href=\"https://www.kaggle.com/takashisomeya\" target=\"_blank\">@takashisomeya</a> </p>",
      "rawMarkdown": "Thanks you so much for sharing @takashisomeya",
      "votes": null
    },
    {
      "id": "2312660",
      "postDate": "06/22/2023 05:19:30",
      "content": "<p><a href=\"https://www.kaggle.com/takashisomeya\" target=\"_blank\">@takashisomeya</a> congrats! Thank you for sharing detailed topic!</p>",
      "rawMarkdown": "takashisomeya congrats! Thank you for sharing detailed topic!",
      "votes": null
    },
    {
      "id": "2313618",
      "postDate": "06/22/2023 19:16:54",
      "content": "<p>Congrats on your gold, and thanks for sharing your solution.<br>\nRegarding scatter plots:<br>\nIt appears that you didn't detect tick labels, so you have no info about their coordinates, how did you map scatter points to their values?</p>",
      "rawMarkdown": "Congrats on your gold, and thanks for sharing your solution.\nRegarding scatter plots:\nIt appears that you didn't detect tick labels, so you have no info about their coordinates, how did you map scatter points to their values?",
      "votes": null
    },
    {
      "id": "2314828",
      "postDate": "06/23/2023 16:10:56",
      "content": "<p>Yes, we didn't detect tick labels pixel coordinates, instead we simply read min/max values of x/y tick labels by matcha.<br>\nThen, these min/max values are mapped to pixel coordinates as (x_min, y_min) -&gt; (0,0), (x_max, y_max) -&gt; (w', h') where w', h' are the width and height of the graph after cropping by plot-bb.<br>\nBut as you know, the min/max tick labels do not always coincide with the edge of the image. So, to be honest, our approach is inadequate and there is still room for score improvement.</p>",
      "rawMarkdown": "Yes, we didn't detect tick labels pixel coordinates, instead we simply read min/max values of x/y tick labels by matcha.\nThen, these min/max values are mapped to pixel coordinates as (x_min, y_min) -> (0,0), (x_max, y_max) -> (w', h') where w', h' are the width and height of the graph after cropping by plot-bb.\nBut as you know, the min/max tick labels do not always coincide with the edge of the image. So, to be honest, our approach is inadequate and there is still room for score improvement.",
      "votes": null
    },
    {
      "id": "2315044",
      "postDate": "06/23/2023 19:20:03",
      "content": "<p>Thank you for the explanation. It has cleared everything. I must say, I am impressed with how you utilized Matcha for scatter plots. Your approach simplifies the post-processing required to obtain scatter points. Well deserved</p>",
      "rawMarkdown": "Thank you for the explanation. It has cleared everything. I must say, I am impressed with how you utilized Matcha for scatter plots. Your approach simplifies the post-processing required to obtain scatter points. Well deserved",
      "votes": null
    }
  ],
  "comments": [
    {
      "id": 2312308,
      "author_name": "akshitsharma1",
      "author_url": "",
      "post_date": "06/21/2023 19:53:09",
      "content": "<p>Thanks you so much for sharing <a href=\"https://www.kaggle.com/takashisomeya\" target=\"_blank\">@takashisomeya</a> </p>",
      "votes": null,
      "replies": []
    },
    {
      "id": 2312660,
      "author_name": "serangu",
      "author_url": "",
      "post_date": "06/22/2023 05:19:30",
      "content": "<p><a href=\"https://www.kaggle.com/takashisomeya\" target=\"_blank\">@takashisomeya</a> congrats! Thank you for sharing detailed topic!</p>",
      "votes": null,
      "replies": []
    },
    {
      "id": 2313618,
      "author_name": "tanjiroll",
      "author_url": "",
      "post_date": "06/22/2023 19:16:54",
      "content": "<p>Congrats on your gold, and thanks for sharing your solution.<br>\nRegarding scatter plots:<br>\nIt appears that you didn't detect tick labels, so you have no info about their coordinates, how did you map scatter points to their values?</p>",
      "votes": null,
      "replies": [
        {
          "id": 2314828,
          "author_name": "takashisomeya",
          "author_url": "",
          "post_date": "06/23/2023 16:10:56",
          "content": "<p>Yes, we didn't detect tick labels pixel coordinates, instead we simply read min/max values of x/y tick labels by matcha.<br>\nThen, these min/max values are mapped to pixel coordinates as (x_min, y_min) -&gt; (0,0), (x_max, y_max) -&gt; (w', h') where w', h' are the width and height of the graph after cropping by plot-bb.<br>\nBut as you know, the min/max tick labels do not always coincide with the edge of the image. So, to be honest, our approach is inadequate and there is still room for score improvement.</p>",
          "votes": null,
          "replies": [
            {
              "id": 2315044,
              "author_name": "tanjiroll",
              "author_url": "",
              "post_date": "06/23/2023 19:20:03",
              "content": "<p>Thank you for the explanation. It has cleared everything. I must say, I am impressed with how you utilized Matcha for scatter plots. Your approach simplifies the post-processing required to obtain scatter points. Well deserved</p>",
              "votes": null,
              "replies": []
            }
          ]
        }
      ]
    }
  ],
  "raw_markdown_by_id": {
    "2311921": "Congratulations to all the winners and thanks to the organizers for hosting this interesting competition.\nI would also like to thank my teammate @fuumin621 for working with me on this challenging task.\n\n# SUMMARY\nSimilar to other solutions, our pipeline also consists of object detection for scatter points and end-to-end plot prediction by deplot for other graphs.\n**Scatter plots**: plot-bb detection with YOLOX + scatter point detection with YOLOX + OCR of max/min axis labels with matcha\n**Other graphs**: deplot trained with original synthetic data\n\n# Scatter point detection\nWe used the following two steps object detection to detect scatter points and determined the coordinates of scatter points from the axis labels read by matcha.\n\nStep 1. plot-bb detection by YOLOX (model size : x, image size : 640)\nStep 2. scatter points detection with \"plot-bb cropped\" image by YOLOX (model size : x, image size : 960)\n\nTraining data for step.2 is the competition data (generated, extracted)+ 538 scatter plots from ICDAR dataset.\n\nPublic LB : Private LB = 0.09 : 0.29\n\n# Bar graph, line graph, dot graph\n\nWe used a variety of graph data sources for training deplot,\n\n1. generated graph (competition data)\n2. extracted graph (competition data)\n3. ICDAR dataset (1185 single series + 2992 multiple series)\n4. @brendanartley 's 500k dataset (except scatter)\n5. original synthetic dataset (vertical bar: 40000, horizontal bar: 40000, line: 40000)\n6. original synthetic dataset (histogram : 10000)\n\n## original dataset (generated by matplotlib)\nOur key focus of this competition is data generation.\nWe generated graphs with various patterns to make our model robust against unknown private dataset.\nThe generated graphs were evaluated using the competition dataset (extracted) and the ICDAR dataset.\nContinuous graph modification and feedback from error analysis allowed predictions to be made on difficult data.\nOur data was especially helpful in improving the accuracy of line graphs (so it is very important whether the line is on the tick label or not!).\n\nSome attempts for improving common mistakes:\n- line plot with no value on some tick labels\n- JPG compression to lower quality (simulate low resolution and blurred characters)\n- add symbols ($ % , .) to distinguish numbers and symbols (like 8 and $)\n- extended predicted digits for small values (like < 0.0001)\n- separate labels into multiple lines\n- etc..\n\nSome examples of our generated graphs are shown below.\n\n![](https://www.googleapis.com/download/storage/v1/b/kaggle-forum-message-attachments/o/inbox%2F6102861%2F8e95529288fbfda2462e21336fb43b5b%2F00000008.jpeg?generation=1687351996558599&alt=media)\n\n![](https://www.googleapis.com/download/storage/v1/b/kaggle-forum-message-attachments/o/inbox%2F6102861%2F392cab76953662bed1d6fc6f17be4e59%2F00000054.jpeg?generation=1687352984294446&alt=media)\n\n![](https://www.googleapis.com/download/storage/v1/b/kaggle-forum-message-attachments/o/inbox%2F6102861%2F2dfff51c40cb57f1793b4c56fbea2560%2F00000042.jpeg?generation=1687353205159183&alt=media)\n\n![](https://www.googleapis.com/download/storage/v1/b/kaggle-forum-message-attachments/o/inbox%2F6102861%2F584b0585fa82beffd0d3cd771c347bd3%2F00000081.jpeg?generation=1687357868152994&alt=media)\n\n## Training (deplot)\n### training data configuration\n| source | # of samples per epoch | total graphs |\n| --- | --- |\n| generated | 1000| 50000 |\n| extracted | 953 | 953 |\n| ICDAR | 1000 | 4177 |\n| 500k dataset | 1000 | 400000 |\n| original synthetic data | 2000 | 120000 | \n| original synthetic data (histogram) | 100 | 10000 | \n\nFor each epoch, we randomly sampled the graphs for each source at the above ratios.\n\n### training conditions\nepochs: 50\nlearning rate: 2e-4\nscheduler: cosine annealing\nbatch (accumulation): 64\n\n# Final results\n\n| chart-type | Public LB | Private LB |\n| --- | --- |\n| all | 0.86| 0.69 |\n| vertical bar | 0.39 | 0.26 |\n| horizontal bar | 0.04 | 0.01 |\n| line | 0.32 | 0.12 |\n| scatter | 0.09| 0.29 |\n| dot | 0 | 0 |",
    "2312308": "Thanks you so much for sharing @takashisomeya",
    "2312660": "takashisomeya congrats! Thank you for sharing detailed topic!",
    "2313618": "Congrats on your gold, and thanks for sharing your solution.\nRegarding scatter plots:\nIt appears that you didn't detect tick labels, so you have no info about their coordinates, how did you map scatter points to their values?",
    "2314828": "Yes, we didn't detect tick labels pixel coordinates, instead we simply read min/max values of x/y tick labels by matcha.\nThen, these min/max values are mapped to pixel coordinates as (x_min, y_min) -> (0,0), (x_max, y_max) -> (w', h') where w', h' are the width and height of the graph after cropping by plot-bb.\nBut as you know, the min/max tick labels do not always coincide with the edge of the image. So, to be honest, our approach is inadequate and there is still room for score improvement.",
    "2315044": "Thank you for the explanation. It has cleared everything. I must say, I am impressed with how you utilized Matcha for scatter plots. Your approach simplifies the post-processing required to obtain scatter points. Well deserved"
  },
  "source": "meta"
}