
Thanks to kaggle and benetech for hosting an interesting problem. It was a great team effort with @darraghdog
\nOur solution is a 4 seed blend of a single deplot model for all chart types. For scatter plots we run additional post processing by using the number of scatter points predicted by a U-Net point segmentation model.
\nFor training we used all of benetech extracted data, and approx 20% of the generated data which was selected based on the hardest samples. This helped speed up the training pipeline significantly.
\nNumerical values had a lot of digits in ground truth which did not match well with our loss function (cross entropy) in pix2struct based models. Therefore, it was important to round these numerical values. For this, we bucketed the labels to approx 5 buckets within the tick label axis. So, for example, the buckets in the below would be 0, 40000, 80000, 120000, 160000, 200000, 240000… etc. and the y-axis label to learn would be 840000, 960000, 760000, 700000, 580000, 460000, etc.. For ground truth labels which had no tick labels, similar rounding was performed based on the min-max range of the data series, using approximately 40 buckets.
Within the pix2struct model, the labels were learned as key-value sequences, similar to the training of deplot. For the example above, that would be
\n <pad>Malaysia;960000|Malawi;840000|Maldives;760000|Mali;700000|Mauritania;660000|Melanesia;580000|Malta;580000|Mauritius;540000|Martinique;460000|Mayotte;420000<\\s>
A separate decoder was used to learn the reversed key-value sequence. This was linked to the same encoder and added as an auxiliary loss so the model would not focus more on either side of the image. Since the heavy part of deplot is the encoder, a double decoder did not create much overhead.
\nFor this competition, we utilized a commercially available subset of PubMed articles to train our models. Approximately 80% of the labeled samples in the ICDAR dataset were found to originate from this commercial dataset. We ensured that the use of this dataset complied with the applicable licensing terms. To expand our training data, we applied pseudo-labeling techniques followed by manual review. Specifically, we pseudo-labeled and manually reviewed around 8,000 bar and line graph samples from PubMed articles. The pseudo-labeling results were quite accurate on bars, requiring only verification that the identified charts were the correct type (e.g. removing box plots). Lines needed some corrections. We also used our U-Net model to pseudo-label approximately 1,000 scatter plot samples from PubMed, and then manually added any missing data points. Using the VGG Image Annotator tool, this manual annotation process was surprisingly fast and efficient.
\nWe used the great public kernel by @brendanartley in two ways
\nWe pretrained our deplot models using the 500k images downloadable the public kernel, which gave a small improvement, compared to using the original checkpoint from huggingface.
\nWe also tweaked the kernel a bit to generate more sophisticated scatter plots (more points, different markers, more overlap etc) and output x/y coordinates of each scatter point. We generated 50k scatter plots with that script and used them additionally for training the segmentation model
\nDeplot was used for predicting bars, lines and scatter; for scatter, we additionally used a u-net model.
\nDeplot was trained for 20 epochs, with a learning rate of approx 5e-5 and batchsize 8. Pixeldropout augmentation was found to prevent overfitting. No other image augmentations were used. For experimentation, 1024 patches were used which decreased training time 2X with only a slight degradation in scores. The loss was a combination of cross entropy on the key value sequences mentioned above and the chart type. A linear layer on top of the first token of deplot was used to predict the chart type as an auxiliary.
\nFor scatter plots we used a U-Net (EfficientNet-B7 encoder) + non maximum suppression (NMS) to predict number of scatter points and performed a simple yet effective postprocessing where deplot predicted a different number of points:
\nBelow you can see the segmentation mask for U-Net training. Using the scatter point annotation we created “smooth” points with 10 pixel gaussian radius and drew onto an empty image.
\n
For deplot we did inner ensembling by averaging decoder prediction in each greedy decoding step. For Unet we simply averaged predicted masks before performing NMS.
\nThe following table gives a quick overview, how much each component contributed to our solution
\n| component | \nscore | \n
|---|---|
| Baseline deplot@1024 tokens | \n0.71 | \n
| using fullfit | \n+0.01 | \n
| 1024 -> 2048 tokens | \n+0.03 | \n
| Scatter pp Unet@512x512 | \n+0.05 | \n
| Pixeldropout | \n+0.01 | \n
| External data | \n+0.02 | \n
| Pretrain on 500k | \n+0.01 | \n
| Unet@512x512 -> 768x768 | \n+0.01 | \n
| 3x Unet@768x768 | \n+0.01 | \n
| 4x seed blend of deplots | \n+0.01 | \n
| final score | \n0.87 | \n
Thank you for reading, questions welcome
\nedit:
\nJune 21st: inference kernel made public: https://www.kaggle.com/code/christofhenkel/benetech-6th-place-dd/notebook
", "messages": [ { "id": "2311018", "postDate": "06/20/2023 20:14:51", "content": "Thanks to kaggle and benetech for hosting an interesting problem. It was a great team effort with @darraghdog
\nOur solution is a 4 seed blend of a single deplot model for all chart types. For scatter plots we run additional post processing by using the number of scatter points predicted by a U-Net point segmentation model.
\nFor training we used all of benetech extracted data, and approx 20% of the generated data which was selected based on the hardest samples. This helped speed up the training pipeline significantly.
\nNumerical values had a lot of digits in ground truth which did not match well with our loss function (cross entropy) in pix2struct based models. Therefore, it was important to round these numerical values. For this, we bucketed the labels to approx 5 buckets within the tick label axis. So, for example, the buckets in the below would be 0, 40000, 80000, 120000, 160000, 200000, 240000… etc. and the y-axis label to learn would be 840000, 960000, 760000, 700000, 580000, 460000, etc.. For ground truth labels which had no tick labels, similar rounding was performed based on the min-max range of the data series, using approximately 40 buckets.
Within the pix2struct model, the labels were learned as key-value sequences, similar to the training of deplot. For the example above, that would be
\n <pad>Malaysia;960000|Malawi;840000|Maldives;760000|Mali;700000|Mauritania;660000|Melanesia;580000|Malta;580000|Mauritius;540000|Martinique;460000|Mayotte;420000<\\s>
A separate decoder was used to learn the reversed key-value sequence. This was linked to the same encoder and added as an auxiliary loss so the model would not focus more on either side of the image. Since the heavy part of deplot is the encoder, a double decoder did not create much overhead.
\nFor this competition, we utilized a commercially available subset of PubMed articles to train our models. Approximately 80% of the labeled samples in the ICDAR dataset were found to originate from this commercial dataset. We ensured that the use of this dataset complied with the applicable licensing terms. To expand our training data, we applied pseudo-labeling techniques followed by manual review. Specifically, we pseudo-labeled and manually reviewed around 8,000 bar and line graph samples from PubMed articles. The pseudo-labeling results were quite accurate on bars, requiring only verification that the identified charts were the correct type (e.g. removing box plots). Lines needed some corrections. We also used our U-Net model to pseudo-label approximately 1,000 scatter plot samples from PubMed, and then manually added any missing data points. Using the VGG Image Annotator tool, this manual annotation process was surprisingly fast and efficient.
\nWe used the great public kernel by @brendanartley in two ways
\nWe pretrained our deplot models using the 500k images downloadable the public kernel, which gave a small improvement, compared to using the original checkpoint from huggingface.
\nWe also tweaked the kernel a bit to generate more sophisticated scatter plots (more points, different markers, more overlap etc) and output x/y coordinates of each scatter point. We generated 50k scatter plots with that script and used them additionally for training the segmentation model
\nDeplot was used for predicting bars, lines and scatter; for scatter, we additionally used a u-net model.
\nDeplot was trained for 20 epochs, with a learning rate of approx 5e-5 and batchsize 8. Pixeldropout augmentation was found to prevent overfitting. No other image augmentations were used. For experimentation, 1024 patches were used which decreased training time 2X with only a slight degradation in scores. The loss was a combination of cross entropy on the key value sequences mentioned above and the chart type. A linear layer on top of the first token of deplot was used to predict the chart type as an auxiliary.
\nFor scatter plots we used a U-Net (EfficientNet-B7 encoder) + non maximum suppression (NMS) to predict number of scatter points and performed a simple yet effective postprocessing where deplot predicted a different number of points:
\nBelow you can see the segmentation mask for U-Net training. Using the scatter point annotation we created “smooth” points with 10 pixel gaussian radius and drew onto an empty image.
\n
For deplot we did inner ensembling by averaging decoder prediction in each greedy decoding step. For Unet we simply averaged predicted masks before performing NMS.
\nThe following table gives a quick overview, how much each component contributed to our solution
\n| component | \nscore | \n
|---|---|
| Baseline deplot@1024 tokens | \n0.71 | \n
| using fullfit | \n+0.01 | \n
| 1024 -> 2048 tokens | \n+0.03 | \n
| Scatter pp Unet@512x512 | \n+0.05 | \n
| Pixeldropout | \n+0.01 | \n
| External data | \n+0.02 | \n
| Pretrain on 500k | \n+0.01 | \n
| Unet@512x512 -> 768x768 | \n+0.01 | \n
| 3x Unet@768x768 | \n+0.01 | \n
| 4x seed blend of deplots | \n+0.01 | \n
| final score | \n0.87 | \n
Thank you for reading, questions welcome
\nedit:
\nJune 21st: inference kernel made public: https://www.kaggle.com/code/christofhenkel/benetech-6th-place-dd/notebook
", "rawMarkdown": "Thanks to kaggle and benetech for hosting an interesting problem. It was a great team effort with @darraghdog \n\n## TLDR\nOur solution is a 4 seed blend of a single deplot model for all chart types. For scatter plots we run additional post processing by using the number of scatter points predicted by a U-Net point segmentation model. \n\n## Data preprocessing\n\n### Benetech dataset\n\nFor training we used all of benetech extracted data, and approx 20% of the generated data which was selected based on the hardest samples. This helped speed up the training pipeline significantly. \nNumerical values had a lot of digits in ground truth which did not match well with our loss function (cross entropy) in pix2struct based models. Therefore, it was important to round these numerical values. For this, we bucketed the labels to approx 5 buckets within the tick label axis. So, for example, the buckets in the below would be `0, 40000, 80000, 120000, 160000, 200000, 240000… etc.` and the y-axis label to learn would be `840000, 960000, 760000, 700000, 580000, 460000, etc.`. For ground truth labels which had no tick labels, similar rounding was performed based on the min-max range of the data series, using approximately 40 buckets. \n\n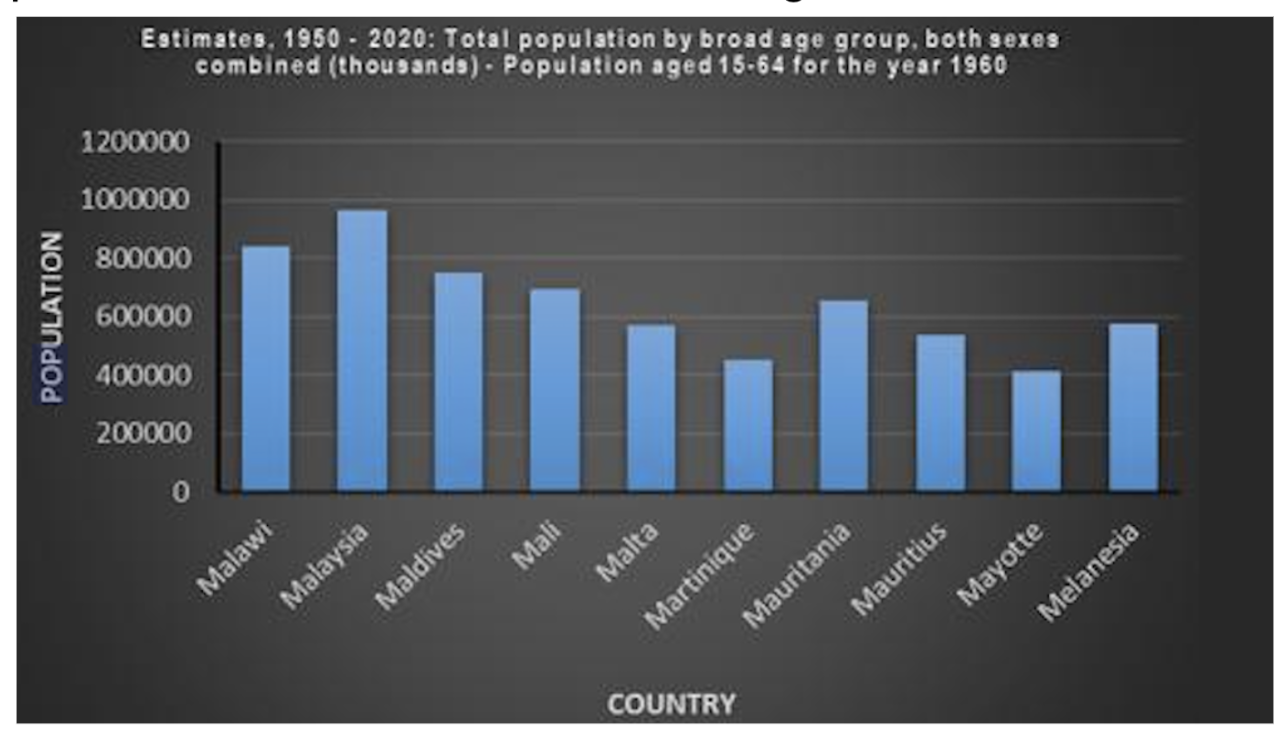\n\nWithin the pix2struct model, the labels were learned as key-value sequences, similar to the training of deplot. For the example above, that would be\n `Did you try out matcha? We used it with the ground truth format similar to @nbroad's donut approach.
\ndeplot worked with the ground truth format like you used, but performed slightly worse than matcha overall.
matcha didn't work well on scatter though … so we didn't use it at all for scatter.
", "rawMarkdown": "Did you try out matcha? We used it with the ground truth format similar to @nbroad's donut approach.\ndeplot worked with the ground truth format like you used, but performed slightly worse than matcha overall.\n\nmatcha didn't work well on scatter though ... so we didn't use it at all for scatter.", "votes": null }, { "id": "2311032", "postDate": "06/20/2023 20:51:53", "content": "In the beginning matcha was way worse for us. But after we found that pretraining helps, matcha was roughly same as deplot. We also tried Pix2Struct Large. But no luck there.
", "rawMarkdown": "In the beginning matcha was way worse for us. But after we found that pretraining helps, matcha was roughly same as deplot. We also tried Pix2Struct Large. But no luck there.", "votes": null }, { "id": "2311035", "postDate": "06/20/2023 20:53:03", "content": "Strange. It was always the other way around for us. matcha was always better than deplot.
", "rawMarkdown": "Strange. It was always the other way around for us. matcha was always better than deplot.", "votes": null }, { "id": "2311036", "postDate": "06/20/2023 20:57:44", "content": "Noob question here (not an expert in object detection), how did you manage your object detector to predict the right number of data series points? For instance, I selected a probability threshold which optimized the correct number of exact matches. However, sometimes I could get false positives (longer sequences) or get a shorter sequence. Also, which timm backbone did you use?
Thanks and congratulations
", "rawMarkdown": "Noob question here (not an expert in object detection), how did you manage your object detector to predict the right number of data series points? For instance, I selected a probability threshold which optimized the correct number of exact matches. However, sometimes I could get false positives (longer sequences) or get a shorter sequence. Also, which `timm` backbone did you use? \n\nThanks and congratulations", "votes": null }, { "id": "2311037", "postDate": "06/20/2023 21:04:49", "content": "Say x_seg is your predicted segmentation mask. Run non maximum supression and count number of remaining positive pixels
\n x_pred = x_seg.sigmoid()\n x_pooled = F.max_pool2d(x_pred, kernel_size=self.nms_kernel_size, stride=, padding=self.nms_padding)\n x_pred[x_pred != x_pooled] = \n n_pred = (x_pred[:,] > self.n_threshold).((,))\n\n\nAlso, which timm backbone did you use?
\n
Stated in the modeling section: U-Net (EfficientNet-B7 encoder) Segmentation models pytorch enables using most of encoders from timm. So for us it was tf_efficientnet_b7_ns
", "rawMarkdown": "Say x_seg is your predicted segmentation mask. Run non maximum supression and count number of remaining positive pixels\n\n```python\n x_pred = x_seg.sigmoid()\n x_pooled = F.max_pool2d(x_pred, kernel_size=self.nms_kernel_size, stride=1, padding=self.nms_padding)\n x_pred[x_pred != x_pooled] = 0\n n_pred = (x_pred[:,0] > self.n_threshold).sum((1,2))\n```\n\n>Also, which timm backbone did you use?\n\nStated in the modeling section: U-Net (EfficientNet-B7 encoder) Segmentation models pytorch enables using most of encoders from timm. So for us it was tf_efficientnet_b7_ns", "votes": null }, { "id": "2311038", "postDate": "06/20/2023 21:09:07", "content": "Awesome job!
\nIf you had an additional week or two, what else would you have tried?
", "rawMarkdown": "Awesome job!\n\nIf you had an additional week or two, what else would you have tried?", "votes": null }, { "id": "2311040", "postDate": "06/20/2023 21:13:38", "content": "I am extremely happy there was no more additional weeks. This one extra was too much 🤣
", "rawMarkdown": "I am extremely happy there was no more additional weeks. This one extra was too much 🤣", "votes": null }, { "id": "2311041", "postDate": "06/20/2023 21:16:09", "content": "True! I'm just curious what ideas never got explored
", "rawMarkdown": "True! I'm just curious what ideas never got explored", "votes": null }, { "id": "2311042", "postDate": "06/20/2023 21:23:05", "content": "I wanted to try to change the vision model and the text model from Pix2Struct and see if other backbones performed better but didnt find out how. Do you happen to know how to do this?
", "rawMarkdown": "I wanted to try to change the vision model and the text model from Pix2Struct and see if other backbones performed better but didnt find out how. Do you happen to know how to do this?", "votes": null }, { "id": "2311043", "postDate": "06/20/2023 21:27:21", "content": "Thanks for the comprehensive write-up and nice use of the double decoder, nice approach.
\nHow were you able to output the x/y coordinates of generated scatter plots?
", "rawMarkdown": "Thanks for the comprehensive write-up and nice use of the double decoder, nice approach.\n\nHow were you able to output the x/y coordinates of generated scatter plots?", "votes": null }, { "id": "2311047", "postDate": "06/20/2023 21:30:56", "content": "Our best submission doesn't use external data. I tried to incorporate ICDAR on the night of the license change announcment, but who knows what was the quality of those labels. I didn't have the time to go over them. I had to spawn new gpus as fast as I could 😅 training on 4gpus would take more than 1 day.
\nI'd add cleanly labeled external data.
", "rawMarkdown": "Our best submission doesn't use external data. I tried to incorporate ICDAR on the night of the license change announcment, but who knows what was the quality of those labels. I didn't have the time to go over them. I had to spawn new gpus as fast as I could 😅 training on 4gpus would take more than 1 day.\n\nI'd add cleanly labeled external data.", "votes": null }, { "id": "2311051", "postDate": "06/20/2023 21:36:29", "content": "Thank you @vishnus for jarvislabs. I think I spent 500 USD in the last 2 days trying to retrain models due to license change announcment. Saved me on icecube as well. It was impossible to get instances immediately on gcp or aws.
", "rawMarkdown": "Thank you @vishnus for jarvislabs. I think I spent 500 USD in the last 2 days trying to retrain models due to license change announcment. Saved me on icecube as well. It was impossible to get instances immediately on gcp or aws.", "votes": null }, { "id": "2311052", "postDate": "06/20/2023 21:37:46", "content": "@alejopaullier
\nThere is a generic VisionEncoderDecoderModel that could potentially do what you want. MatCha/DePlot have the advantage that they already had a significant amount of training, so I would assume a new pair would struggle without that.
Right, you wouldn't be able to use pretrained weights :(
", "rawMarkdown": "Right, you wouldn't be able to use pretrained weights :(", "votes": null }, { "id": "2311068", "postDate": "06/20/2023 22:16:47", "content": "You can use pretrained weights. The cross attention ones will be newly initialized but everything else will be fine
", "rawMarkdown": "[You can use pretrained weights](https://huggingface.co/docs/transformers/model_doc/vision-encoder-decoder#initialising-visionencoderdecodermodel-from-a-pretrained-encoder-and-a-pretrained-decoder). The cross attention ones will be newly initialized but everything else will be fine", "votes": null }, { "id": "2311148", "postDate": "06/21/2023 00:36:30", "content": "add those two lines
\nxy_pixels = ax.transData.transform(np.vstack([xs,ys]).T)\nnp.save(config.out_file + .(fnum), xy_pixels)\nafter
\nfig.savefig(config.out_file + .(fnum))\nNow I know why I was unable to reserve a100 gpus in Jarvislabs for last few days 😅
", "rawMarkdown": "Now I know why I was unable to reserve a100 gpus in Jarvislabs for last few days 😅", "votes": null }, { "id": "2311196", "postDate": "06/21/2023 02:22:27", "content": "I wanted to try finetuning pix2struct-large directly (google/pix2struct-chartqa-large would be better starting point, but strangely this checkpoint is missing in HF, although it was trained by google), since matcha/deplot had only base models. Data also wasn't a problem since we could have generated as many synthetic plots as necessary. But it would have been too expensive…
", "rawMarkdown": "I wanted to try finetuning pix2struct-large directly (google/pix2struct-chartqa-large would be better starting point, but strangely this checkpoint is missing in HF, although it was trained by google), since matcha/deplot had only base models. Data also wasn't a problem since we could have generated as many synthetic plots as necessary. But it would have been too expensive...", "votes": null }, { "id": "2311203", "postDate": "06/21/2023 02:31:29", "content": "In my training runs, Matcha did better in initial stages, however validation scores for Matcha/Deplot converge with longer training
", "rawMarkdown": "In my training runs, Matcha did better in initial stages, however validation scores for Matcha/Deplot converge with longer training", "votes": null }, { "id": "2311207", "postDate": "06/21/2023 02:35:15", "content": "\n\n\nI think I spent 500 USD in the last 2 days
\n
It's good that you get prize money to cover that 😄
", "rawMarkdown": "crodoc \n\n> I think I spent 500 USD in the last 2 days\n\nIt's good that you get prize money to cover that 😄", "votes": null }, { "id": "2311466", "postDate": "06/21/2023 07:13:42", "content": "@christofhenkel Congrats for prize!
\nI have a question, the nms (max_pool2d) you mentioned above seems that it is hard to process the situation when two or more scatters overlap together?
Yes, I took them all. Along with all A6000s and even 4x A5000 🤣
", "rawMarkdown": "Yes, I took them all. Along with all A6000s and even 4x A5000 🤣", "votes": null }, { "id": "2311520", "postDate": "06/21/2023 07:55:22", "content": "@conjuring92 did you use different ground truth format for marcha and deplot? Or it didn't matter? For us, deplot was more sensitive to the format.
", "rawMarkdown": "conjuring92 did you use different ground truth format for marcha and deplot? Or it didn't matter? For us, deplot was more sensitive to the format.", "votes": null }, { "id": "2311564", "postDate": "06/21/2023 08:38:10", "content": "nms_kernel_size of 3 will keep maximum within distance of 3. As long as the center pixel of both scatter points is more than 3 pixels away its fine.
\nA good practice is to check the model capability by using the gt segmentation mask. performing NMS with kernel size 3 on those will get the number of scatter points correct with an accuracy 99.7%. If you increase NMS kenrel to 5 the accuracy drops to 95% because of exactly the issue you mentioned: overlapping points
", "rawMarkdown": "nms_kernel_size of 3 will keep maximum within distance of 3. As long as the center pixel of both scatter points is more than 3 pixels away its fine.\n\nA good practice is to check the model capability by using the gt segmentation mask. performing NMS with kernel size 3 on those will get the number of scatter points correct with an accuracy 99.7%. If you increase NMS kenrel to 5 the accuracy drops to 95% because of exactly the issue you mentioned: overlapping points", "votes": null }, { "id": "2311573", "postDate": "06/21/2023 08:44:32", "content": "Thanks for your reply!
", "rawMarkdown": "Thanks for your reply!", "votes": null }, { "id": "2312019", "postDate": "06/21/2023 15:56:22", "content": "Impressive 6th place solution combining deplot and UNet models. Effective data preprocessing, including rounding numerical values and bucketing labels. Utilized external data and pseudo-labeling techniques. Ensembling through averaging decoder predictions and mask averaging. Achieved a high score of 0.87 in the competition. Well done!
", "rawMarkdown": "Impressive 6th place solution combining deplot and UNet models. Effective data preprocessing, including rounding numerical values and bucketing labels. Utilized external data and pseudo-labeling techniques. Ensembling through averaging decoder predictions and mask averaging. Achieved a high score of 0.87 in the competition. Well done!", "votes": null }, { "id": "2313479", "postDate": "06/22/2023 17:53:56", "content": "useful thks
", "rawMarkdown": "useful thks", "votes": null }, { "id": "2319396", "postDate": "06/27/2023 05:28:42", "content": "@christofhenkel very interesting solution! Thanks!
", "rawMarkdown": "christofhenkel very interesting solution! Thanks!", "votes": null } ], "comments": [ { "id": 2311030, "author_name": "crodoc", "author_url": "", "post_date": "06/20/2023 20:49:03", "content": "Did you try out matcha? We used it with the ground truth format similar to @nbroad's donut approach.
\ndeplot worked with the ground truth format like you used, but performed slightly worse than matcha overall.
matcha didn't work well on scatter though … so we didn't use it at all for scatter.
", "votes": null, "replies": [ { "id": 2311032, "author_name": "christofhenkel", "author_url": "", "post_date": "06/20/2023 20:51:53", "content": "In the beginning matcha was way worse for us. But after we found that pretraining helps, matcha was roughly same as deplot. We also tried Pix2Struct Large. But no luck there.
", "votes": null, "replies": [ { "id": 2311035, "author_name": "crodoc", "author_url": "", "post_date": "06/20/2023 20:53:03", "content": "Strange. It was always the other way around for us. matcha was always better than deplot.
", "votes": null, "replies": [] }, { "id": 2311203, "author_name": "conjuring92", "author_url": "", "post_date": "06/21/2023 02:31:29", "content": "In my training runs, Matcha did better in initial stages, however validation scores for Matcha/Deplot converge with longer training
", "votes": null, "replies": [ { "id": 2311520, "author_name": "crodoc", "author_url": "", "post_date": "06/21/2023 07:55:22", "content": "@conjuring92 did you use different ground truth format for marcha and deplot? Or it didn't matter? For us, deplot was more sensitive to the format.
", "votes": null, "replies": [] } ] } ] } ] }, { "id": 2311036, "author_name": "alejopaullier", "author_url": "", "post_date": "06/20/2023 20:57:44", "content": "Noob question here (not an expert in object detection), how did you manage your object detector to predict the right number of data series points? For instance, I selected a probability threshold which optimized the correct number of exact matches. However, sometimes I could get false positives (longer sequences) or get a shorter sequence. Also, which timm backbone did you use?
Thanks and congratulations
", "votes": null, "replies": [ { "id": 2311037, "author_name": "christofhenkel", "author_url": "", "post_date": "06/20/2023 21:04:49", "content": "Say x_seg is your predicted segmentation mask. Run non maximum supression and count number of remaining positive pixels
\n x_pred = x_seg.sigmoid()\n x_pooled = F.max_pool2d(x_pred, kernel_size=self.nms_kernel_size, stride=, padding=self.nms_padding)\n x_pred[x_pred != x_pooled] = \n n_pred = (x_pred[:,] > self.n_threshold).((,))\n\n\nAlso, which timm backbone did you use?
\n
Stated in the modeling section: U-Net (EfficientNet-B7 encoder) Segmentation models pytorch enables using most of encoders from timm. So for us it was tf_efficientnet_b7_ns
", "votes": null, "replies": [ { "id": 2311466, "author_name": "fankaixie", "author_url": "", "post_date": "06/21/2023 07:13:42", "content": "@christofhenkel Congrats for prize!
\nI have a question, the nms (max_pool2d) you mentioned above seems that it is hard to process the situation when two or more scatters overlap together?
nms_kernel_size of 3 will keep maximum within distance of 3. As long as the center pixel of both scatter points is more than 3 pixels away its fine.
\nA good practice is to check the model capability by using the gt segmentation mask. performing NMS with kernel size 3 on those will get the number of scatter points correct with an accuracy 99.7%. If you increase NMS kenrel to 5 the accuracy drops to 95% because of exactly the issue you mentioned: overlapping points
", "votes": null, "replies": [ { "id": 2311573, "author_name": "fankaixie", "author_url": "", "post_date": "06/21/2023 08:44:32", "content": "Thanks for your reply!
", "votes": null, "replies": [] } ] } ] } ] } ] }, { "id": 2311038, "author_name": "nbroad", "author_url": "", "post_date": "06/20/2023 21:09:07", "content": "Awesome job!
\nIf you had an additional week or two, what else would you have tried?
", "votes": null, "replies": [ { "id": 2311040, "author_name": "crodoc", "author_url": "", "post_date": "06/20/2023 21:13:38", "content": "I am extremely happy there was no more additional weeks. This one extra was too much 🤣
", "votes": null, "replies": [ { "id": 2311041, "author_name": "nbroad", "author_url": "", "post_date": "06/20/2023 21:16:09", "content": "True! I'm just curious what ideas never got explored
", "votes": null, "replies": [ { "id": 2311047, "author_name": "crodoc", "author_url": "", "post_date": "06/20/2023 21:30:56", "content": "Our best submission doesn't use external data. I tried to incorporate ICDAR on the night of the license change announcment, but who knows what was the quality of those labels. I didn't have the time to go over them. I had to spawn new gpus as fast as I could 😅 training on 4gpus would take more than 1 day.
\nI'd add cleanly labeled external data.
", "votes": null, "replies": [ { "id": 2311051, "author_name": "crodoc", "author_url": "", "post_date": "06/20/2023 21:36:29", "content": "Thank you @vishnus for jarvislabs. I think I spent 500 USD in the last 2 days trying to retrain models due to license change announcment. Saved me on icecube as well. It was impossible to get instances immediately on gcp or aws.
", "votes": null, "replies": [ { "id": 2311192, "author_name": "conjuring92", "author_url": "", "post_date": "06/21/2023 02:17:57", "content": "Now I know why I was unable to reserve a100 gpus in Jarvislabs for last few days 😅
", "votes": null, "replies": [ { "id": 2311516, "author_name": "crodoc", "author_url": "", "post_date": "06/21/2023 07:53:25", "content": "Yes, I took them all. Along with all A6000s and even 4x A5000 🤣
", "votes": null, "replies": [] } ] }, { "id": 2311207, "author_name": "nbroad", "author_url": "", "post_date": "06/21/2023 02:35:15", "content": "\n\n\nI think I spent 500 USD in the last 2 days
\n
It's good that you get prize money to cover that 😄
", "votes": null, "replies": [] } ] } ] } ] } ] }, { "id": 2311042, "author_name": "alejopaullier", "author_url": "", "post_date": "06/20/2023 21:23:05", "content": "I wanted to try to change the vision model and the text model from Pix2Struct and see if other backbones performed better but didnt find out how. Do you happen to know how to do this?
", "votes": null, "replies": [ { "id": 2311052, "author_name": "nbroad", "author_url": "", "post_date": "06/20/2023 21:37:46", "content": "@alejopaullier
\nThere is a generic VisionEncoderDecoderModel that could potentially do what you want. MatCha/DePlot have the advantage that they already had a significant amount of training, so I would assume a new pair would struggle without that.
Right, you wouldn't be able to use pretrained weights :(
", "votes": null, "replies": [ { "id": 2311068, "author_name": "nbroad", "author_url": "", "post_date": "06/20/2023 22:16:47", "content": "You can use pretrained weights. The cross attention ones will be newly initialized but everything else will be fine
", "votes": null, "replies": [ { "id": 2311196, "author_name": "conjuring92", "author_url": "", "post_date": "06/21/2023 02:22:27", "content": "I wanted to try finetuning pix2struct-large directly (google/pix2struct-chartqa-large would be better starting point, but strangely this checkpoint is missing in HF, although it was trained by google), since matcha/deplot had only base models. Data also wasn't a problem since we could have generated as many synthetic plots as necessary. But it would have been too expensive…
", "votes": null, "replies": [] } ] } ] } ] } ] } ] }, { "id": 2311043, "author_name": "brendanartley", "author_url": "", "post_date": "06/20/2023 21:27:21", "content": "Thanks for the comprehensive write-up and nice use of the double decoder, nice approach.
\nHow were you able to output the x/y coordinates of generated scatter plots?
", "votes": null, "replies": [ { "id": 2311148, "author_name": "christofhenkel", "author_url": "", "post_date": "06/21/2023 00:36:30", "content": "add those two lines
\nxy_pixels = ax.transData.transform(np.vstack([xs,ys]).T)\nnp.save(config.out_file + .(fnum), xy_pixels)\nafter
\nfig.savefig(config.out_file + .(fnum))\nImpressive 6th place solution combining deplot and UNet models. Effective data preprocessing, including rounding numerical values and bucketing labels. Utilized external data and pseudo-labeling techniques. Ensembling through averaging decoder predictions and mask averaging. Achieved a high score of 0.87 in the competition. Well done!
", "votes": null, "replies": [] }, { "id": 2313479, "author_name": "vandittyagi0909", "author_url": "", "post_date": "06/22/2023 17:53:56", "content": "useful thks
", "votes": null, "replies": [] }, { "id": 2319396, "author_name": "serangu", "author_url": "", "post_date": "06/27/2023 05:28:42", "content": "@christofhenkel very interesting solution! Thanks!
", "votes": null, "replies": [] } ], "raw_markdown_by_id": { "2311018": "Thanks to kaggle and benetech for hosting an interesting problem. It was a great team effort with @darraghdog \n\n## TLDR\nOur solution is a 4 seed blend of a single deplot model for all chart types. For scatter plots we run additional post processing by using the number of scatter points predicted by a U-Net point segmentation model. \n\n## Data preprocessing\n\n### Benetech dataset\n\nFor training we used all of benetech extracted data, and approx 20% of the generated data which was selected based on the hardest samples. This helped speed up the training pipeline significantly. \nNumerical values had a lot of digits in ground truth which did not match well with our loss function (cross entropy) in pix2struct based models. Therefore, it was important to round these numerical values. For this, we bucketed the labels to approx 5 buckets within the tick label axis. So, for example, the buckets in the below would be `0, 40000, 80000, 120000, 160000, 200000, 240000… etc.` and the y-axis label to learn would be `840000, 960000, 760000, 700000, 580000, 460000, etc.`. For ground truth labels which had no tick labels, similar rounding was performed based on the min-max range of the data series, using approximately 40 buckets. \n\n\n\nWithin the pix2struct model, the labels were learned as key-value sequences, similar to the training of deplot. For the example above, that would be\n `