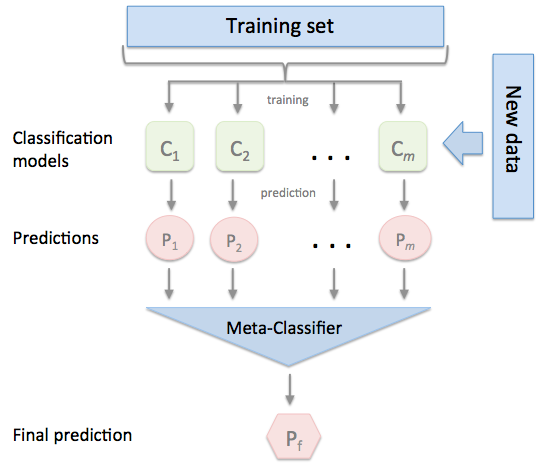
{"cells":[{"metadata":{},"cell_type":"markdown","source":"<img src='https://www.commonfloor.com/articles/wp-content/uploads/2012/07/dva1-300x199.jpg' width=500>\n<div align=\"center\"><font size=\"2\">Source: Google</font></div>"},{"metadata":{},"cell_type":"markdown","source":"<p>This is a Playground competition which will give you the opportunity to try different encoding schemes for different algorithms and compare how they perform.</p>\n\n<p> This is the follow up competition to the previous categorical encoding challenge 1</p>\n\n<p> The features are given as below </p> \n    \n    \n* binary features\n* low- and high-cardinality nominal features\n* low- and high-cardinality ordinal features\n* (potentially) cyclical features"},{"metadata":{},"cell_type":"markdown","source":"> **Change of status:**\n> Update_v2: Stacking with Histgbm,catboost,logistic    \n"},{"metadata":{},"cell_type":"markdown","source":"<font color='#000000' size=4>Objective</font><br>\n\n* Exploration and finding interactions\n* Build models\n* Evaluate models"},{"metadata":{},"cell_type":"markdown","source":"**Let's start tickling!!**"},{"metadata":{},"cell_type":"markdown","source":"<font color='#088a5a' size=3>Kindly upvote the kernel if you like it!</font><br>"},{"metadata":{"_uuid":"8f2839f25d086af736a60e9eeb907d3b93b6e0e5","_cell_guid":"b1076dfc-b9ad-4769-8c92-a6c4dae69d19","trusted":true},"cell_type":"code","source":"# This Python 3 environment comes with many helpful analytics libraries installed\n# It is defined by the kaggle/python docker image: https://github.com/kaggle/docker-python\n# For example, here's several helpful packages to load in \n\n!pip install --upgrade scikit-learn\n\nimport numpy as np # linear algebra\nimport pandas as pd # data processing, CSV file I/O (e.g. pd.read_csv)\nimport os\nfrom IPython.core.display import display, HTML\nimport pandas_profiling as pp\nfrom plotly import tools\nimport plotly.offline as py\npy.init_notebook_mode(connected=True)\nimport plotly.graph_objs as go\nfrom plotly.offline import init_notebook_mode, iplot\nimport matplotlib.pyplot as plt\nfrom IPython.display import Markdown\nimport scipy.stats as ss\nimport itertools\nimport seaborn as sns\nimport category_encoders as ce\nfrom sklearn.model_selection import StratifiedKFold\nfrom sklearn import metrics, preprocessing\nfrom sklearn.metrics import auc,plot_roc_curve\nimport datetime\nfrom time import time\nfrom catboost import CatBoostClassifier\nfrom sklearn.experimental import enable_hist_gradient_boosting  # noqa\nfrom sklearn.ensemble import HistGradientBoostingClassifier\nfrom sklearn.linear_model import LogisticRegression\nfrom sklearn.ensemble import StackingClassifier\n\n# Any results you write to the current directory are saved as output.","execution_count":null,"outputs":[]},{"metadata":{"_uuid":"d629ff2d2480ee46fbb7e2d37f6b5fab8052498a","collapsed":true,"_cell_guid":"79c7e3d0-c299-4dcb-8224-4455121ee9b0","trusted":false},"cell_type":"markdown","source":"<font color='#088a5a' size=4>Data glimpse</font><br>"},{"metadata":{"trusted":true},"cell_type":"code","source":"path='../input/cat-in-the-dat-ii/'\n\ntrain=pd.read_csv(path+'train.csv')\ntest=pd.read_csv(path+'test.csv')\nsubmission=pd.read_csv(path+'sample_submission.csv')\n","execution_count":null,"outputs":[]},{"metadata":{"trusted":true},"cell_type":"code","source":"display(HTML(f\"\"\"\n   \n        <ul class=\"list-group\">\n          <li class=\"list-group-item disabled\" aria-disabled=\"true\"><h4>Shape of Train and Test Dataset</h4></li>\n          <li class=\"list-group-item\"><h4>Number of rows in Train dataset is: <span class=\"label label-primary\">{ train.shape[0]:,}</span></h4></li>\n          <li class=\"list-group-item\"> <h4>Number of columns Train dataset is <span class=\"label label-primary\">{train.shape[1]}</span></h4></li>\n          <li class=\"list-group-item\"><h4>Number of rows in Test dataset is: <span class=\"label label-success\">{ test.shape[0]:,}</span></h4></li>\n          <li class=\"list-group-item\"><h4>Number of columns Test dataset is <span class=\"label label-success\">{test.shape[1]}</span></h4></li>\n        </ul>\n  \n    \"\"\"))","execution_count":null,"outputs":[]},{"metadata":{},"cell_type":"markdown","source":"<font color='#0000ff' size=3>Panda's profiling</font><br>"},{"metadata":{},"cell_type":"markdown","source":"Taking a fraction of data(1%) for checking the over-view of data"},{"metadata":{"trusted":true},"cell_type":"code","source":"sample_profile=train.sample(frac=0.01)\n\npp.ProfileReport(sample_profile)","execution_count":null,"outputs":[]},{"metadata":{},"cell_type":"markdown","source":"<font color='#088a5a' size=4>Data walk through</font><br>"},{"metadata":{"trusted":true},"cell_type":"code","source":"def resumetable(df):\n    print(f\"Dataset Shape: {df.shape}\")\n    summary = pd.DataFrame(df.dtypes,columns=['dtypes'])\n    summary = summary.reset_index()\n    summary['Name'] = summary['index']\n    summary = summary[['Name','dtypes']]\n    summary['Missing'] = df.isnull().sum().values\n    summary['Total'] = df.count().values   \n    summary['Missing Percentage']=(summary['Missing']/summary['Total'])*100\n    summary['Uniques'] = df.nunique().values\n\n    return summary","execution_count":null,"outputs":[]},{"metadata":{"trusted":true},"cell_type":"code","source":"trainsum = resumetable(train)\ntrainsum","execution_count":null,"outputs":[]},{"metadata":{"trusted":true},"cell_type":"code","source":"testsum = resumetable(test)\ntestsum","execution_count":null,"outputs":[]},{"metadata":{},"cell_type":"markdown","source":"Trivia:\n\n* There seems to be around only 3% of missing values in both training and test data\n* Nominal features 5 to 9 has more unique values in both training and test data"},{"metadata":{},"cell_type":"markdown","source":"<font color='#0000ff' size=3>Target distribution</font><br>"},{"metadata":{"trusted":true},"cell_type":"code","source":"## target distribution ##\ncnt_srs=train.target.value_counts()\n\nlabels = (np.array(cnt_srs.index))\nsizes = (np.array((cnt_srs / cnt_srs.sum())*100))\n\ntrace = go.Pie(labels=labels, values=sizes)\nlayout = go.Layout(\n    title='Target distribution',\n    font=dict(size=15),\n    width=500,\n    height=500,\n)\ndata = [trace]\nfig = go.Figure(data=data, layout=layout)\npy.iplot(fig, filename=\"usertype\")","execution_count":null,"outputs":[]},{"metadata":{},"cell_type":"markdown","source":"Trivia:\n\n* There is a huge imbalance between targets 0 (81.3%) and 1 (18.7%)"},{"metadata":{"trusted":true},"cell_type":"code","source":"bin_features=[i for i in train.columns if i.split('_')[0]=='bin']\nord_features=[i for i in train.columns if i.split('_')[0]=='ord']\nnom_features=[i for i in train.columns if i.split('_')[0]=='nom']\n\ncyc_features=[i for i in train.columns if i in ['day','month']]","execution_count":null,"outputs":[]},{"metadata":{},"cell_type":"markdown","source":"Thanks to this wonderful [kernel](https://www.kaggle.com/vikassingh1996/handling-categorical-variables-encoding-modeling) for the below charts "},{"metadata":{},"cell_type":"markdown","source":"<font color='#0000ff' size=3>Binary variables</font><br>"},{"metadata":{"trusted":true},"cell_type":"code","source":"'''#2.Function for displaying bar lebels in relative scale.'''\ndef pct_bar_labels():\n    font_size = 15\n    plt.ylabel('Relative Frequency (%)', fontsize = font_size)\n    plt.xticks(rotation = 0, fontsize = font_size)\n    plt.yticks([]) \n    \n    # Set individual bar lebels in proportional scale\n    for x in ax1.patches:\n        ax1.annotate(str(x.get_height()) + '%', \n        (x.get_x() + x.get_width()/2., x.get_height()), ha = 'center', va = 'center', xytext = (0, 7), \n        textcoords = 'offset points', fontsize = font_size, color = 'black')\n        \n'''Display markdown formatted output like bold, italic bold etc.'''\n\ndef bold(string):\n    display(Markdown(string))","execution_count":null,"outputs":[]},{"metadata":{"trusted":true},"cell_type":"code","source":"'''Create a function that relative frequency of Target variable by a categorical variable. \nAnd then plots the relative frequency of target by a categorical variable.'''\n\ndef crosstab(cat, cat_target, color):\n    '''cat = categorical variable, cat_target = our target categorical variable.'''\n    global ax1\n    fig_size = (18, 5)\n    title_size = 18\n    font_size = 15\n    \n    pct_cat_grouped_by_cat_target = round(pd.crosstab(index = cat, columns = cat_target, normalize = 'index')*100, 2)\n       \n    # Plot relative frequrncy of Target by a categorical variable\n    ax1 = pct_cat_grouped_by_cat_target.plot.bar(color = color, title = 'Percentage Count of target by %s' %cat.name, figsize = fig_size)\n    ax1.title.set_size(fontsize = title_size)\n    pct_bar_labels()\n    plt.xlabel(cat.name, fontsize = font_size)\n    plt.show()","execution_count":null,"outputs":[]},{"metadata":{"trusted":true},"cell_type":"code","source":"'''Plot the binary variables in relative scale'''\n\nfor i,val in enumerate(bin_features):\n    bold(f'**Percentage Count of target by {val}:**')\n    crosstab(train[val], train.target, color = ['g', 'b'])","execution_count":null,"outputs":[]},{"metadata":{},"cell_type":"markdown","source":"<font color='#0000ff' size=3>Ordinal variables</font><br>"},{"metadata":{"trusted":true},"cell_type":"code","source":"'''Plot the ordinal variables in relative scale'''\n\nfor i,val in enumerate(ord_features[:3]):\n    bold(f'**Percentage Count of target by {val}:**')\n    crosstab(train[val], train.target, color = ['y', 'b'])","execution_count":null,"outputs":[]},{"metadata":{},"cell_type":"markdown","source":"<font color='#0000ff' size=3>Nominal variables</font><br>"},{"metadata":{"trusted":true},"cell_type":"code","source":"'''Plot the nominal variables in relative scale'''\n\nfor i,val in enumerate(nom_features[:5]):\n    bold(f'**Percentage Count of target by {val}:**')\n    crosstab(train[val], train.target, color = ['r', 'g'])","execution_count":null,"outputs":[]},{"metadata":{},"cell_type":"markdown","source":"<font color='#0000ff' size=3>Cyclical variables</font><br>"},{"metadata":{"trusted":true},"cell_type":"code","source":"'''Plot the cyclic variables in relative scale'''\n\nfor i,val in enumerate(cyc_features):\n    bold(f'**Percentage Count of target by {val}:**')\n    crosstab(train[val], train.target, color = ['y', 'b'])","execution_count":null,"outputs":[]},{"metadata":{},"cell_type":"markdown","source":"Trivia:\n\n* There is a again a huge percentage differnce across all cat variables between targets"},{"metadata":{},"cell_type":"markdown","source":"<font color='#0000ff' size=3>Interaction between cat variables - Crammer's rule</font><br>"},{"metadata":{"trusted":true},"cell_type":"code","source":"train_copy=train.dropna()","execution_count":null,"outputs":[]},{"metadata":{"trusted":true},"cell_type":"code","source":"def cramers_v(x, y):\n    confusion_matrix = pd.crosstab(x,y)\n    chi2 = ss.chi2_contingency(confusion_matrix)[0]\n    n = confusion_matrix.sum().sum()\n    phi2 = chi2/n\n    r,k = confusion_matrix.shape\n    phi2corr = max(0, phi2-((k-1)*(r-1))/(n-1))\n    rcorr = r-((r-1)**2)/(n-1)\n    kcorr = k-((k-1)**2)/(n-1)\n    return np.sqrt(phi2corr/min((kcorr-1),(rcorr-1)))\n\nall_feat=bin_features+nom_features+ord_features+cyc_features","execution_count":null,"outputs":[]},{"metadata":{"trusted":true},"cell_type":"code","source":"corrM = np.zeros((len(all_feat),len(all_feat)))\n\nfor col1, col2 in itertools.combinations(all_feat, 2):\n    idx1, idx2 = all_feat.index(col1), all_feat.index(col2)\n    corrM[idx1, idx2] = cramers_v(train_copy[col1], train_copy[col2])\n    corrM[idx2, idx1] = corrM[idx1, idx2]\n\ncorr = pd.DataFrame(corrM, index=all_feat, columns=all_feat)\nfig, ax = plt.subplots(figsize=(15, 10))\nax = sns.heatmap(round(corr,2), annot=True, ax=ax); ax.set_title(\"Cramer V Correlation between Variables\");\n\ndel train_copy","execution_count":null,"outputs":[]},{"metadata":{},"cell_type":"markdown","source":"Trivia:\n\n* Looks like there is no much of interactions between variables."},{"metadata":{},"cell_type":"markdown","source":"<font color='#088a5a' size=4>Data encoding and cleaning</font><br>"},{"metadata":{"trusted":true},"cell_type":"code","source":"# CREDITS : https://www.kaggle.com/caesarlupum/2020-20-lines-target-encoding\n\ndef encoding(train, test, smooth):\n    print('Target encoding...')\n    train.sort_index(inplace=True)\n    target = train['target']\n    test_id = test['id']\n    train.drop(['target', 'id'], axis=1, inplace=True)\n    test.drop('id', axis=1, inplace=True)\n    cat_feat_to_encode = bin_features+nom_features+ord_features+cyc_features\n    smoothing=smooth\n    oof = pd.DataFrame([])\n    \n    for tr_idx, oof_idx in StratifiedKFold(n_splits=5, random_state=2020, shuffle=True).split(train, target):\n        ce_target_encoder = ce.TargetEncoder(cols = cat_feat_to_encode, smoothing=smoothing)\n        ce_target_encoder.fit(train.iloc[tr_idx, :], target.iloc[tr_idx])\n        oof = oof.append(ce_target_encoder.transform(train.iloc[oof_idx, :]), ignore_index=False)\n        \n    ce_target_encoder = ce.TargetEncoder(cols = cat_feat_to_encode, smoothing=smoothing)\n    ce_target_encoder.fit(train, target)\n    train = oof.sort_index()\n    test = ce_target_encoder.transform(test)\n    features = list(train)\n    print('Target encoding done!')\n    return train, test, test_id, features, target\n","execution_count":null,"outputs":[]},{"metadata":{"trusted":true},"cell_type":"code","source":"# Encoding\ntrain_encode, test_encode, test_id, features, target = encoding(train, test, 0.3)","execution_count":null,"outputs":[]},{"metadata":{},"cell_type":"markdown","source":"<font color='#088a5a' size=4>Modelling and inference- MEOW</font><br>"},{"metadata":{"trusted":true},"cell_type":"code","source":"train_encode=pd.concat([train_encode,target],axis=1,ignore_index=True)\ntrain_encode.columns=list(train.columns)+['target']","execution_count":null,"outputs":[]},{"metadata":{"trusted":true},"cell_type":"code","source":"X, y = train_encode[all_feat], train_encode['target']","execution_count":null,"outputs":[]},{"metadata":{"trusted":true},"cell_type":"code","source":"def make_classifier():\n    clf = CatBoostClassifier(\n                               loss_function='CrossEntropy',\n                               eval_metric=\"AUC\",\n                               task_type=\"CPU\",\n                               learning_rate=0.05,\n                               n_estimators =100,   #5000\n                               early_stopping_rounds=10,\n                               random_seed=2019,\n                               silent=True\n                              )\n        \n    return clf\n\n#oof = np.zeros(len(X))","execution_count":null,"outputs":[]},{"metadata":{"trusted":true},"cell_type":"code","source":"# preds = np.zeros(len(test_encode))\n# oof = np.zeros(len(X))\n# NFOLDS = 10\n\n# folds = StratifiedKFold(n_splits=NFOLDS, shuffle=True, random_state=2019)\n\n\n# training_start_time = time()\n# for fold, (trn_idx, test_idx) in enumerate(folds.split(X, y)):\n#     start_time = time()\n#     print(f'Training on fold {fold+1}')\n#     clf = make_classifier()\n#     clf.fit(X.loc[trn_idx, all_feat], y.loc[trn_idx], eval_set=(X.loc[test_idx, all_feat], y.loc[test_idx]),\n#                           use_best_model=True, verbose=500)\n    \n#     preds += clf.predict_proba(test_encode)[:,1]/NFOLDS\n#     oof[test_idx] = clf.predict_proba(X.loc[test_idx, all_feat])[:,1]\n    \n#     print('Fold {} finished in {}'.format(fold + 1, str(datetime.timedelta(seconds=time() - start_time))))\n    \n# print('-' * 30)\n# print('OOF',metrics.roc_auc_score(y, oof))\n# print('-' * 30)","execution_count":null,"outputs":[]},{"metadata":{},"cell_type":"markdown","source":"<font color='#0000ff' size=3>Stacking classifiers</font><br>"},{"metadata":{},"cell_type":"markdown","source":"<p>Stacking is an ensemble learning technique to combine multiple classification models via a meta-classifier. Here we will choose catboost,histgbm as our base classifiers and logistic regression as final estimator\n</p>"},{"metadata":{},"cell_type":"markdown","source":"<img src='http://rasbt.github.io/mlxtend/user_guide/classifier/StackingClassifier_files/stackingclassification_overview.png' width=500>\n<div align=\"center\"><font size=\"2\">Source: Google</font></div>"},{"metadata":{},"cell_type":"markdown","source":"Trivia - HistGBM:\n*     It's based on LightGBM implementation and it's much faster than other GBM's. \n*     It's still in experimental stage as of now"},{"metadata":{},"cell_type":"markdown","source":"<font color='#088a5a' size=4>Stacking</font><br>"},{"metadata":{},"cell_type":"markdown","source":"The below implementation is inspired from this [kernel](https://www.kaggle.com/nicapotato/whats-new-sklearn-0-22-1-cat-classifier-stack)"},{"metadata":{"trusted":true},"cell_type":"code","source":"scoring = \"roc_auc\"\n\nHistGBM_param = {\n    'l2_regularization': 0.0,\n    'loss': 'auto',\n    'max_bins': 255,\n    'max_depth': 15,\n    'max_leaf_nodes': 31,\n    'min_samples_leaf': 20,\n    'n_iter_no_change': 50,\n    'scoring': scoring,\n    'tol': 1e-07,\n    'validation_fraction': 0.15,\n    'verbose': 0,\n    'warm_start': False   \n}\n\nfolds = StratifiedKFold(n_splits=3, shuffle=True, random_state=1)\nfold_preds = np.zeros([test_encode.shape[0],3])\noof_preds = np.zeros([X.shape[0],3])\nresults = {}\n\nestimators = [\n        ('histgbm', HistGradientBoostingClassifier(**HistGBM_param)),\n        ('catboost', make_classifier())\n    ]\n\n# Fit Folds\nf, ax = plt.subplots(1,3,figsize = [14,5])\nfor i, (trn_idx, val_idx) in enumerate(folds.split(X,y)):\n    print(f\"Fold {i} stacking....\")\n    clf = StackingClassifier(\n            estimators=estimators,\n            final_estimator=LogisticRegression(),\n            )\n    clf.fit(X.loc[trn_idx,:], y.loc[trn_idx])\n    tmp_pred = clf.predict_proba(X.loc[val_idx,:])[:,1]\n    \n    oof_preds[val_idx,0] = tmp_pred\n    fold_preds[:,0] += clf.predict_proba(test_encode)[:,1] / folds.n_splits\n        \n    estimator_performance = {}\n    estimator_performance['stack_score'] = metrics.roc_auc_score(y.loc[val_idx], tmp_pred)\n    \n    for ii, est in enumerate(estimators):\n            model = clf.named_estimators_[est[0]]\n            pred = model.predict_proba(X.loc[val_idx,:])[:,1]\n            oof_preds[val_idx, ii+1] = pred\n            fold_preds[:,ii+1] += model.predict_proba(test_encode)[:,1] / folds.n_splits\n            estimator_performance[est[0]+\"_score\"] = metrics.roc_auc_score(y.loc[val_idx], pred)\n            \n    stack_coefficients = {x+\"_coefficient\":y for (x,y) in zip([x[0] for x in estimators], clf.final_estimator_.coef_[0])}\n    stack_coefficients['intercept'] = clf.final_estimator_.intercept_[0]\n        \n    results[\"Fold {}\".format(str(i+1))] = [\n            estimator_performance,\n            stack_coefficients\n        ]\n\n    plot_roc_curve(clf, X.loc[val_idx,:], y.loc[val_idx], ax=ax[i])\n    ax[i].plot([0.0, 1.0])\n    ax[i].set_title(\"Fold {} - ROC AUC\".format(str(i)))\n\nplt.tight_layout(pad=2)\nplt.show()\n\nf, ax = plt.subplots(1,2,figsize = [11,5])\nsns.heatmap(pd.DataFrame(oof_preds, columns = ['stack','histgbm','catboost']).corr(),\n            annot=True, fmt=\".2f\",cbar_kws={'label': 'Correlation Coefficient'},cmap=\"magma\",ax=ax[0])\nax[0].set_title(\"OOF PRED - Correlation Plot\")\nsns.heatmap(pd.DataFrame(fold_preds, columns = ['stack','histgbm','catboost']).corr(),\n            annot=True, fmt=\".2f\",cbar_kws={'label': 'Correlation Coefficient'},cmap=\"inferno\",ax=ax[1])\nax[1].set_title(\"TEST PRED - Correlation Plot\")\nplt.tight_layout(pad=3)\nplt.show()","execution_count":null,"outputs":[]},{"metadata":{"trusted":true},"cell_type":"markdown","source":"Let's take the stacked classifier output and submit the predictions"},{"metadata":{"trusted":true},"cell_type":"code","source":"submission['target'] =fold_preds[:,0] #preds\nsubmission.to_csv('submission.csv', index=None)\nsubmission.head()","execution_count":null,"outputs":[]},{"metadata":{"trusted":true},"cell_type":"code","source":"submission['target'].plot(kind='hist')","execution_count":null,"outputs":[]},{"metadata":{},"cell_type":"markdown","source":"<font color='#088a5a' size=4>Stay tuned!!</font><br>"},{"metadata":{"trusted":true},"cell_type":"code","source":"","execution_count":null,"outputs":[]}],"metadata":{"kernelspec":{"language":"python","display_name":"Python 3","name":"python3"},"language_info":{"pygments_lexer":"ipython3","nbconvert_exporter":"python","version":"3.6.4","file_extension":".py","codemirror_mode":{"name":"ipython","version":3},"name":"python","mimetype":"text/x-python"}},"nbformat":4,"nbformat_minor":1}