
Participants are free to use any datasets in addition to the official Kaggle dataset, but those datasets must be public and hosted on Kaggle for the submission to be valid.
\nThere is a $3,000 prize for the most useful public dataset shared prior to 11/4/2020. Please share a link to your dataset, along with a description of its contents, in the thread below to increase its visibility.
\nThe winning dataset will be an external dataset that helps to address the following problem statement: Develop a methodology for calculating key performance indicators (KPIs) that relate to the environmental and social issues that are discussed in the CDP survey data. Leverage external data sources and thoroughly discuss the intersection between environmental issues and social issues. Mine information to create automated insight generation demonstrating whether city and corporate ambitions take these factors into account.
You can find a few examples of external datasets that we feel might be useful to you if you navigate to the /Kaggle/cdp-unlocking-climate-solutions/Supplementary Data/ folder in the official competition dataset. Another idea could be to export some geospatial data from Earth Engine (e.g. https://www.kaggle.com/c/ds4g-environmental-insights-explorer/) and save it as a public Kaggle Dataset for ease of use. Be creative!
ND-GAIN: Urban Adaptation Assessment
\nHey there,
\nI found this dataset from ND-GAIN extremely useful. It includes climate risk hazards by city linked to extreme temperature fluctuations, drought, floods and rising sea levels for the United States.
\nI think that the data and the research from ND-GAIN is really relevant for this project and is really worth looking at.
The Storm Events Database is an integrated database of severe weather events across the United States, with information about a storm event's location, azimuth, distance, impact, and severity, including the cost of damages to property and crops. It contains data documenting:
\nThe Kaggle datasets contain information for storms and tornadoes that hit the U.S. between-2013 till 2020 and has been collected from the National Oceanic And Atmospheric Administration's Storm Events database hosted on Google BigQuery: https://console.cloud.google.com/marketplace/product/noaa-public/severe-storm-events?project=scenic-helper-291002
\nThere is a lot of existing literature exploring the possibility of a linkage between rising greenhouse gas emissions and extreme weather events. I think this dataset can be combined with the existing CDP data to test if there could be an association between severe storms and emissions (extrapolated from the cities/corporations responses) in the U.S.
", "rawMarkdown": "[NOAA Severe Storm Database](https://www.kaggle.com/atinakarim/noaa-severe-storm-database)\n\nThe Storm Events Database is an integrated database of severe weather events across the United States, with information about a storm event's location, azimuth, distance, impact, and severity, including the cost of damages to property and crops. It contains data documenting:\n- The occurrence of storms and other significant weather phenomena having sufficient intensity to cause loss of life, injuries, significant property damage, and/or disruption to commerce\n- Rare, unusual, weather phenomena that generate media attention, such as snow flurries in South Florida or the San Diego coastal area\n- Other significant meteorological events, such as record maximum or minimum temperatures or precipitation that occur in connection with another event.\n\nThe Kaggle datasets contain information for storms and tornadoes that hit the U.S. between-2013 till 2020 and has been collected from the National Oceanic And Atmospheric Administration's Storm Events database hosted on Google BigQuery: https://console.cloud.google.com/marketplace/product/noaa-public/severe-storm-events?project=scenic-helper-291002\n\nThere is a lot of existing literature exploring the possibility of a linkage between rising greenhouse gas emissions and extreme weather events. I think this dataset can be combined with the existing CDP data to test if there could be an association between severe storms and emissions (extrapolated from the cities/corporations responses) in the U.S. \n", "votes": 3 }, { "id": 1069576, "postDate": "2020-11-04T16:08:01.123Z", "content": "An increasing amount of high-resolution global spatial data are available and used for various assessments. However, key environmental and socioeconomic indicators are still mainly provided only at national level. Instead, it would be beneficial to adopt data for sub-national administrative units where available, supplemented by national data where necessary. To this end, this dataset present a compilation of several vector and raster (gridded) data sources, presenting relevant environmental and socioeconomic variables, such as the world population and GDP per 250 m grid, deforestation, air temperature, solar energy potential, among others.
\nThe data are divided into 12 folders:
\n1. Cities and towns (points and polygons) \n2. Roads and railroads\n3. Airports and ports\n4. Power plants\n5. Gridded Population 2015 (250 m)\n6. Gridded Gross Domestic Product and Human Development Index over 1990-2015 \n7. Gridded Land cover 2015\n8. Tree Cover Loss by Dominant Driver\n9. Carbon accumulation potential from natural forest regrowth in forest and savanna biomes\n10. Solar energy potential\n11. Air temperature\n12. Global cattle distribution in 2010 (5 minutes of arc)\nI believe that this dataset can be very useful for the CDP competition, both to assist in analyzing the consistency of the questionnaire data, and to provide data for environmental and socioeconomic indicators.
\nI hope it helps!
Aqueduct GlobalMaps 3.0 Baseline Annual Water Risk
\nThis database enables comparison of water-related risks across large geographies to identify regions or assets deserving of closer attention. Aqueduct 3.0 introduces a water risk framework and new and improved indicators. It also features different hydrological sub-basins. We introduce indicators based on a new hydrological model that now features (1) integrated water supply and demand, (2) surface water and groundwater modelling, (3) higher spatial resolution, and (4) a monthly time series that enables the provision of monthly scores for selected indicators.
", "rawMarkdown": "[Aqueduct GlobalMaps 3.0 Baseline Annual Water Risk](https://www.kaggle.com/rebeccaverghese/aqueduct-global-water-stress-data-maps-30-data)\n\nThis database enables comparison of water-related risks across large geographies to identify regions or assets deserving of closer attention. Aqueduct 3.0 introduces a water risk framework and new and improved indicators. It also features different hydrological sub-basins. We introduce indicators based on a new hydrological model that now features (1) integrated water supply and demand, (2) surface water and groundwater modelling, (3) higher spatial resolution, and (4) a monthly time series that enables the provision of monthly scores for selected indicators.\n", "votes": 3 }, { "id": 1067661, "postDate": "2020-11-02T16:08:48.237Z", "content": "Compiled datasets for CDP Analytics Competition
\nA collection of 20 datasets related to this competition. (Not sure whether this is allowed) Based off my reading, I felt that the problem statement was intentionally extremely broad in scope, addressing:
\nSo in compiling this list, I tried to capture as many of these aspects as possible, both in terms of breadth and depth. I've also organized them by topic to boost its usability if anyone should find it helpful for their work. Some highlights of this set include:
\n1 - Green Growth Indicators by Country (OECD)
\nContains quantifiable metrics on a country's environmental approach from 1990 to 2019, for instance \"Production-based CO2 intensity\", \"Development of environment-related technologies, % all technologies\", \"Environmentally related taxes, % GDP\", \"Environmentally related government R&D budget, % total government R&D\" and more. I think this will be useful as the quantitative counterpart to the qualitative data provided by CDP, since government bureaucrats are incentivized to paint a better picture to some extent, and this can be used as a \"check and balance\" against that.
\n2 - Social Equity datasets at the regional level (OECD)
\nWhen exploring inequity caused by climate change, I think it is equally, if not even more, important that we study its impacts at the regional over country level. A topical example would be the decline of the manufacturing jobs in the Rust Belt in the US due to her reduced reliance on fossil fuels. So these datasets cover large regions (TL2) of every country and measure certain indicators of inequity, such as unemployment, GDP and education. I think it may be interesting to juxtapose these with another attached dataset \"Renewable Jobs by Country\" (IRENA) to see how each region compares to the national performance, and whether factors such as educational attainment may be a viable predictor.
\n3 - Corporate Knights' Top 100 Sustainable Companies 2020 (Corporate Knights)
\nCorporate Knights is an award-winning media, research and financial information products company based in Toronto, focused on promoting \"clean capitalism\" where market actors actively manage the environmental impacts of their business. They publish an annual Top 100 list of companies who have demonstrated their efficacy in being environmental and socially conscious (with greater emphasis on environment) while maintaining a respectable level of profitability. (gross revenue of more than $1 billion in the economic year) Features include the companies' Energy/Carbon/VOC/PM productivities, the companies' sector and country of origin, and social metrics such as sustainability paylink and %women on the board. It is difficult to find open-source datasets on the environmental measures taken by individual companies, since much of this data is behind paywalls. Hopefully, by combining this with datasets on government environmental taxes/policies, some insight can be gained on the intersection of corporate and environmental interests.
\n4 - Statistical costs of premature deaths due to environmental risks by country (OECD)
\nOECD has helpfully compiled a list of the statistical costs of deaths caused by environmental risks such as particulate matter, ozone, unsafe sanitation etc. for every country from 1990 to 2017. This could provide useful insights on the intersection between economic and environmental degradation, as well as inequities on the country level. If this dataset proves too granular, there are also more manageable datasets which directly compare a country's GDP growth with its PM2.5 reading, and its PM2.5 reading with PM-pollution deaths.
\nOther datasets:
\nGDP vs Pollution rates by country (Our World in Data)
\nDeaths by Particulate Matter Air Pollution vs PM25 by country (Our World in Data)
\nCO2 emissions by country (Our World in Data)
\nClimate Vulnerability and Readiness 2015 (ClimateWatch)
\nGINI by country (OECD)
\nRenewable Energy Jobs by Country (IRENA)
\nPercentage of Energy Consumption Global (Our World in Data)
\nFossil Fuel Prices (1989-2019) (BP Statistical Review of World Energy)
\nWRI Sustainable Fiananciing 2019 (World Resource Institute)
\nRenewable Energy Statistics (2010-2019) (IRENA)
My hope is that some of these datasets may assist Kagglers in their data analysis journeys and provide valuable insights to safeguard future generations from the impacts of climate change. Thank you.
", "rawMarkdown": "[Compiled datasets for CDP Analytics Competition](https://www.kaggle.com/seraphimstreets/environmentequity-starterpack)\n\nA collection of 20 datasets related to this competition. (Not sure whether this is allowed) Based off my reading, I felt that the problem statement was intentionally extremely broad in scope, addressing:\n\n1. a plurality of issues (climate change, social justice, equity etc.) \n2. with different groups of stakeholders (governments, people, corporations) \n3. at different spatial scales (country vs region vs city level) \n\nSo in compiling this list, I tried to capture as many of these aspects as possible, both in terms of breadth and depth. I've also organized them by topic to boost its usability if anyone should find it helpful for their work. Some highlights of this set include:\n\n1 - Green Growth Indicators by Country (OECD) \n\nContains quantifiable metrics on a country's environmental approach from 1990 to 2019, for instance \"Production-based CO2 intensity\", \"Development of environment-related technologies, % all technologies\", \"Environmentally related taxes, % GDP\", \"Environmentally related government R&D budget, % total government R&D\" and more. I think this will be useful as the quantitative counterpart to the qualitative data provided by CDP, since government bureaucrats are incentivized to paint a better picture to some extent, and this can be used as a \"check and balance\" against that. \n\n2 - Social Equity datasets at the regional level (OECD)\n\nWhen exploring inequity caused by climate change, I think it is equally, if not even more, important that we study its impacts at the regional over country level. A topical example would be the decline of the manufacturing jobs in the Rust Belt in the US due to her reduced reliance on fossil fuels. So these datasets cover large regions (TL2) of every country and measure certain indicators of inequity, such as unemployment, GDP and education. I think it may be interesting to juxtapose these with another attached dataset \"Renewable Jobs by Country\" (IRENA) to see how each region compares to the national performance, and whether factors such as educational attainment may be a viable predictor. \n\n3 - Corporate Knights' Top 100 Sustainable Companies 2020 (Corporate Knights) \n\nCorporate Knights is an award-winning media, research and financial information products company based in Toronto, focused on promoting \"clean capitalism\" where market actors actively manage the environmental impacts of their business. They publish an annual Top 100 list of companies who have demonstrated their efficacy in being environmental and socially conscious (with greater emphasis on environment) while maintaining a respectable level of profitability. (gross revenue of more than $1 billion in the economic year) Features include the companies' Energy/Carbon/VOC/PM productivities, the companies' sector and country of origin, and social metrics such as sustainability paylink and %women on the board. It is difficult to find open-source datasets on the environmental measures taken by individual companies, since much of this data is behind paywalls. Hopefully, by combining this with datasets on government environmental taxes/policies, some insight can be gained on the intersection of corporate and environmental interests. \n\n4 - Statistical costs of premature deaths due to environmental risks by country (OECD)\n\nOECD has helpfully compiled a list of the statistical costs of deaths caused by environmental risks such as particulate matter, ozone, unsafe sanitation etc. for every country from 1990 to 2017. This could provide useful insights on the intersection between economic and environmental degradation, as well as inequities on the country level. If this dataset proves too granular, there are also more manageable datasets which directly compare a country's GDP growth with its PM2.5 reading, and its PM2.5 reading with PM-pollution deaths. \n\nOther datasets:\nGDP vs Pollution rates by country (Our World in Data)\nDeaths by Particulate Matter Air Pollution vs PM25 by country (Our World in Data)\nCO2 emissions by country (Our World in Data)\nClimate Vulnerability and Readiness 2015 (ClimateWatch)\nGINI by country (OECD)\nRenewable Energy Jobs by Country (IRENA)\nPercentage of Energy Consumption Global (Our World in Data) \nFossil Fuel Prices (1989-2019) (BP Statistical Review of World Energy)\nWRI Sustainable Fiananciing 2019 (World Resource Institute)\nRenewable Energy Statistics (2010-2019) (IRENA) \n\nMy hope is that some of these datasets may assist Kagglers in their data analysis journeys and provide valuable insights to safeguard future generations from the impacts of climate change. Thank you. ", "votes": 3, "replies": [ { "id": 1067886, "postDate": "2020-11-02T19:47:47.857Z", "content": "This looks great! Although if you also include the URLs of the original sources then this would make the attributions section more complete.
", "rawMarkdown": "This looks great! Although if you also include the URLs of the original sources then this would make the attributions section more complete." }, { "id": 1068266, "postDate": "2020-11-03T08:12:41.407Z", "content": "Okay, fixed. Thanks!
", "rawMarkdown": "Okay, fixed. Thanks! " } ] }, { "id": 1059064, "postDate": "2020-10-24T15:10:56.457Z", "content": "World Bank Poverty and Equity Database
\nLatest poverty and inequality indicators compiled from officially recognized international sources. Poverty indicators include the poverty headcount ratio, poverty gap, and number of poor at both international and national poverty lines. Inequality indicators include the Gini index and income or consumption distributions. The database includes national, regional and global estimates.
", "rawMarkdown": "[World Bank Poverty and Equity Database](https://www.kaggle.com/theworldbank/poverty-and-equity-database)\n\nLatest poverty and inequality indicators compiled from officially recognized international sources. Poverty indicators include the poverty headcount ratio, poverty gap, and number of poor at both international and national poverty lines. Inequality indicators include the Gini index and income or consumption distributions. The database includes national, regional and global estimates.", "votes": 3, "replies": [ { "id": 1065187, "postDate": "2020-10-31T01:53:30.957Z", "content": "A thought occurs to me: one big flaw of a lot of city planning approaches (and unfortunately, Green approaches are often even worse in this regard than most) is the overfocus on the local at the expense of the regional or even the county level. \"We will increase property values, utilization et cetera in THIS NEIGHBORHOOD and not even care what happens to the larger region.\" With that in mind, maybe the fact that this is NOT broken down at the city level is actually a feature rather than a bug.
", "rawMarkdown": "A thought occurs to me: one big flaw of a lot of city planning approaches (and unfortunately, Green approaches are often even worse in this regard than most) is the overfocus on the local at the expense of the regional or even the county level. \"We will increase property values, utilization et cetera in THIS NEIGHBORHOOD and not even care what happens to the larger region.\" With that in mind, maybe the fact that this is NOT broken down at the city level is actually a feature rather than a bug." } ] }, { "id": 1065826, "postDate": "2020-10-31T20:33:45.790Z", "content": "Climate Watch: Data for Climate Action
\nVery helpful dataset from the Climate Watch Platform. It includes historical emissions by country, region, industry, and gas by year (1850-2018). Additionally, it covers Nationally Determined Contributions (NDCs) and emission scenario pathways for major emitting countries.
", "rawMarkdown": "[Climate Watch: Data for Climate Action](https://www.kaggle.com/adams3/climatewatch)\n\nVery helpful dataset from the Climate Watch Platform. It includes historical emissions by country, region, industry, and gas by year (1850-2018). Additionally, it covers Nationally Determined Contributions (NDCs) and emission scenario pathways for major emitting countries.", "votes": 4 }, { "id": 1069798, "postDate": "2020-11-05T00:00:11.953Z", "content": "1) https://www.kaggle.com/navinmundhra/world-mortality : Dataset contains mortality rates by country, this could be useful in determining how an area of the world deals with other longterm crises:
\n2) https://www.kaggle.com/lin0li/covid19testing and https://www.kaggle.com/paultimothymooney/coronavirus-covid19-mortality-rate-by-country: Datasets contain covid testing and covid mortality by country, this could be useful to determine how an area of the world deals with a sudden onset of a life-altering event
https://www.kaggle.com/aduaanuoluwapo/multidimensional-poverty-index
\nThis dataset is similar to CDP's Social Vulnerability Index(US COUNTY) except that the Multidimensional Poverty Index(MPI) include major cities in many countries of the world and takes into account factors such as poor health, malnutrition, lack of clean water, unemployment, illiteracy, income as well as income to arrive at the index.
\nThe MPI provides an index after taking into account social vulnerability and environmental indicators.
GHG Emissions by Country and Economic Sector
\nThis dataset contains internationally comparable emissions data on GHG from multiple data source (CAIT, PIK, UNFCCC, GCP) from 1850 to 2018. Additionally, it further shows GHG emissions for six individual economic sectors and subsectors on a global scale. The GHGs include carbon dioxide (CO₂), methane (CH₄), hydrofluorocarbons (HFCs), perfluorocarbons (PFCs), sulfur hexafluoride (SF₆), and nitrous oxide (N₂O). The economic sectors include agriculture, bunker fuels, energy, industrial processes, land-use change/forestry, and waste.
This database contains social indicators provided by the United Nations Statistics Division. The indicators are on population, health, education, housing and work.
\nWater Poverty Index
\nfrom the International Hydrological Programme
\nMultidimensional Poverty Index
\nFrom the United Nations
\nAqueduct
\nWater Risk Atlas from the World Ressource Institue
What a Waste is a global project to aggregate data on solid waste management from around the world. This database features the statistics collected through the effort, covering nearly all countries and over 330 cities. The metrics included cover all steps from the waste management value chain, including waste generation, composition, collection, and disposal, as well as information on user fees and financing, the informal sector, administrative structures, public communication, and legal information. The information presented is the best available based on a study of current literature and limited conversations with waste agencies and authorities. While there may be variations in the definitions and quality of reporting for individual data points, general trends should reflect the global reality. All sources and any estimations are noted.
", "rawMarkdown": "[What A Waste Global Dataset](https://www.kaggle.com/mannmann2/what-a-waste-global-dataset)\n\nWhat a Waste is a global project to aggregate data on solid waste management from around the world. This database features the statistics collected through the effort, covering nearly all countries and over 330 cities. The metrics included cover all steps from the waste management value chain, including waste generation, composition, collection, and disposal, as well as information on user fees and financing, the informal sector, administrative structures, public communication, and legal information. The information presented is the best available based on a study of current literature and limited conversations with waste agencies and authorities. While there may be variations in the definitions and quality of reporting for individual data points, general trends should reflect the global reality. All sources and any estimations are noted.", "votes": 1 }, { "id": 1063807, "postDate": "2020-10-29T11:11:56.397Z", "content": "I apologize for this long post, but, as my \"dataset\" is actually a \"reasoned subset of WorldBank indicators\" (related to UN SDGs and associated inclusion/social change, as well as other economic and social development indicators), I think that it might be useful to others to see what is within the \"menu\"
\nPS if you want to see the dataset on Kaggle without reading the explanation here… dataset on my Kaggle profile - there you can preview also a sample notebook extracting from the Worldwide dataset a presentation on EU27
\nPPS as I do not know yet if I will have time to prepare a submission notebook, at the bottom of the explanation below I shared some ideas about how the KPIs within the dataset might be used to define KPIs for a submission
\nContent
\nAs part of a long-term publishing project (started in 2015 at Expo2015 in Milan), routinely share data that I collect along my writing journey.
\nOn SDG (focus:EU27) I posted a dataset containing indicators from Eurostat, but then on 2020-04-24 (lockdown), decided to expand the dataset by searching within the Worldbank huge collection of indicators those that could be useful in my interim publications focusing on the same themes
\nHence, selected 33 indicators, and created a dataset containing those indicators, adding a sample notebook focused on EU27 to show the content
\nSelection rationale
\nThe criteria for selection of those 33 indicator was:
\nRelease date and timeframe coverage
\nThe collated dataset was released on 2020-04-24, and contains data from 1999 until 2019 (most indicators end in 2018)
\nData transformations done
\nThe processing of the data, as described within the metadata of the dataset, was the following:
\nThe data are \"raw\", i.e. beside the points 3. and 4. above, no transformation has been applied the data cleaning and transformation for the purposes of the data project will be done within the project
\n\"Raw\" WorldBank indicators list
\nIn order to enable to check on the metadata if the information might be of interested to you, this is the list of the indicators:
\n| index | \nkey | \ndescription | \n
|---|---|---|
| 0 | \nCM.MKT.LCAP.GD.ZS | \nMarket capitalization of listed domestic companies (% of GDP) | \n
| 1 | \nEG.IMP.CONS.ZS | \nEnergy imports, net (% of energy use) | \n
| 2 | \nEG.USE.ELEC.KH.PC | \nElectric power consumption (kWh per capita) | \n
| 3 | \nEN.URB.LCTY.UR.ZS | \nPopulation in the largest city (% of urban population) | \n
| 4 | \nFP.CPI.TOTL.ZG | \nInflation, consumer prices (annual %) | \n
| 5 | \nFR.INR.LNDP | \nInterest rate spread (lending rate minus deposit rate, %) | \n
| 6 | \nFS.AST.PRVT.GD.ZS | \nDomestic credit to private sector (% of GDP) | \n
| 7 | \nGB.XPD.RSDV.GD.ZS | \nResearch and development expenditure (% of GDP) | \n
| 8 | \nGC.NLD.TOTL.GD.ZS | \nNet lending (+) / net borrowing (-) (% of GDP) | \n
| 9 | \nGC.TAX.TOTL.GD.ZS | \nTax revenue (% of GDP) | \n
| 10 | \nGC.XPN.TOTL.GD.ZS | \nExpense (% of GDP) | \n
| 11 | \nIC.BUS.DISC.XQ | \nBusiness extent of disclosure index (0=less disclosure to 10=more disclosure) | \n
| 12 | \nIC.CRD.INFO.XQ | \nDepth of credit information index (0=low to 8=high) | \n
| 13 | \nIC.GOV.DURS.ZS | \nTime spent dealing with the requirements of government regulations (% of senior management time) | \n
| 14 | \nIC.LGL.CRED.XQ | \nStrength of legal rights index (0=weak to 12=strong) | \n
| 15 | \nIC.REG.DURS.FE | \nTime required to start a business, female (days) | \n
| 16 | \nIC.REG.DURS.MA | \nTime required to start a business, male (days) | \n
| 17 | \nIC.TAX.TOTL.CP.ZS | \nTotal tax and contribution rate (% of profit) | \n
| 18 | \nIT.CEL.SETS.P2 | \nMobile cellular subscriptions (per 100 people) | \n
| 19 | \nIT.MLT.MAIN.P2 | \nFixed telephone subscriptions (per 100 people) | \n
| 20 | \nIT.NET.BBND.P2 | \nFixed broadband subscriptions (per 100 people) | \n
| 21 | \nLP.LPI.OVRL.XQ | \nLogistics performance index: Overall (1=low to 5=high) | \n
| 22 | \nMS.MIL.XPND.GD.ZS | \nMilitary expenditure (% of GDP) | \n
| 23 | \nNY.GDP.MKTP.KD.ZG | \nGDP growth (annual %) | \n
| 24 | \nSE.PRM.TCAQ.ZS | \nTrained teachers in primary education (% of total teachers) | \n
| 25 | \nSE.XPD.TOTL.GD.ZS | \nGovernment expenditure on education, total (% of GDP) | \n
| 26 | \nSI.POV.GINI | \nGINI index (World Bank estimate) | \n
| 27 | \nSI.POV.URHC | \nUrban poverty headcount ratio at national poverty lines (% of urban population) | \n
| 28 | \nSL.TLF.CACT.FE.ZS | \nLabor force participation rate, female (% of female population ages 15+) (modeled ILO estimate) | \n
| 29 | \nSL.TLF.CACT.MA.ZS | \nLabor force participation rate, male (% of male population ages 15+) (modeled ILO estimate) | \n
| 30 | \nSL.UEM.TOTL.FE.ZS | \nUnemployment, female (% of female labor force) (modeled ILO estimate) | \n
| 31 | \nSL.UEM.TOTL.MA.ZS | \nUnemployment, male (% of male labor force) (modeled ILO estimate) | \n
| 32 | \nSP.URB.TOTL.IN.ZS | \nUrban population (% of total population) | \n
| 33 | \nTX.VAL.TECH.MF.ZS | \nHigh-technology exports (% of manufactured exports) | \n
The \"keycode\" (e.g. TX.VAL.TECH.MF.ZS) can be used on WorldBank search index to both see the metadata, the timeframe available, preview, and select other export options
\n\nPOTENTIAL RESEARCH QUESTIONS COVERED (the list of numbers is the indicator as per the list above, but it is just a sample- compounding and aggregation through a specific analysis model could actually use more or make irrelevant others)
\nHow do you help cities adapt to a rapidly changing climate amidst a global pandemic, but do it in a way that is socially equitable? 3,4,5,6,8,15,16,18,24,25,26,27,28,29,30,31,32
\nWhat are the projects that can be invested in that will help pull cities out of a recession, mitigate climate issues, but not perpetuate racial/social inequities? same as above, but focusing on \"delta\" (i.e. change impact, trend, acceleration/deceleration of change)
\nWhat are the practical and actionable points where city and corporate ambition join, i.e. where do cities have problems that corporations affected by those problems could solve, and vice versa? 1,2,7,11,13,14,21,23,33
\nHow can we measure the intersection between environmental risks and social equity, as a contributor to resiliency? integrate the above with the data from the \"reference\" dataset within the context
", "rawMarkdown": "I apologize for this long post, but, as my \"dataset\" is actually a ***\"reasoned subset of WorldBank indicators\" (related to UN SDGs and associated inclusion/social change, as well as other economic and social development indicators)***, I think that it might be useful to others to see what is within the \"menu\"\n\nPS if you want to see the dataset on Kaggle without reading the explanation here... [dataset on my Kaggle profile](https://www.kaggle.com/robertolofaro/selected-indicators-from-world-bank-20002019) - there you can preview also a sample notebook extracting from the Worldwide dataset a presentation on EU27\n\nPPS as I do not know yet if I will have time to prepare a submission notebook, at the bottom of the explanation below I shared some ideas about how the KPIs within the dataset might be used to define KPIs for a submission\n\n**Content**\n\nAs part of a long-term publishing project (started in 2015 at Expo2015 in Milan), routinely share data that I collect along my writing journey.\n\nOn SDG (focus:EU27) I posted a dataset containing indicators from Eurostat, but then on 2020-04-24 (lockdown), decided to expand the dataset by searching within the Worldbank huge collection of indicators those that could be useful in my interim publications focusing on the same themes\n\nHence, selected 33 indicators, and created a dataset containing those indicators, adding a sample notebook focused on EU27 to show the content\n\n**Selection rationale**\n\nThe criteria for selection of those 33 indicator was:\n1. should be foreseen a routine update by the source (in this case, yearly), if needed\n2. are considered non-partisan (i.e. do not represent a specific agenda, and therefor could be more acceptable as components to indicators to both political activists and business advocates)\n3. each indicator should be provided by a \"domain expert source\" and then collated by an acknowledged \"super-partes\" (again, to improve credibility and perception as non-biased)\n4. last but not least: each indicator should be useful, alone or with others, to help set an agenda for action (e.g. used the indicators on access to Internet, workforce inclusion, urbanization, etc)\n\n**Release date and timeframe coverage**\n\nThe collated dataset was released on 2020-04-24, and contains data from 1999 until 2019 (most indicators end in 2018)\n\n**Data transformations done**\n\nThe processing of the data, as described within the metadata of the dataset, was the following:\n1. requested the ZIP file for each indicator, containing a CSV and two files with metadata \n2. selected subset (2000-2019) \n3. integrated in a single dataset \n4. extracted the \"dimensions\" (Country and Indicator) to reduce size \n\nThe data are \"raw\", i.e. beside the points 3. and 4. above, no transformation has been applied the data cleaning and transformation for the purposes of the data project will be done within the project\n\n**\"Raw\" WorldBank indicators list**\n\nIn order to enable to check on the metadata if the information might be of interested to you, this is the list of the indicators:\n| index | key | description |\n| --- | --- | --- |\n| 0 | CM.MKT.LCAP.GD.ZS | Market capitalization of listed domestic companies (% of GDP) |\n| 1 | EG.IMP.CONS.ZS | Energy imports, net (% of energy use) |\n| 2 | EG.USE.ELEC.KH.PC | Electric power consumption (kWh per capita) |\n| 3 | EN.URB.LCTY.UR.ZS | Population in the largest city (% of urban population) |\n| 4 | FP.CPI.TOTL.ZG | Inflation, consumer prices (annual %) |\n| 5 | FR.INR.LNDP | Interest rate spread (lending rate minus deposit rate, %) |\n| 6 | FS.AST.PRVT.GD.ZS | Domestic credit to private sector (% of GDP) |\n| 7 | GB.XPD.RSDV.GD.ZS | Research and development expenditure (% of GDP) |\n| 8 | GC.NLD.TOTL.GD.ZS | Net lending (+) / net borrowing (-) (% of GDP) |\n| 9 | GC.TAX.TOTL.GD.ZS | Tax revenue (% of GDP) |\n| 10 | GC.XPN.TOTL.GD.ZS | Expense (% of GDP) |\n| 11 | IC.BUS.DISC.XQ | Business extent of disclosure index (0=less disclosure to 10=more disclosure) |\n| 12 | IC.CRD.INFO.XQ | Depth of credit information index (0=low to 8=high) |\n| 13 | IC.GOV.DURS.ZS | Time spent dealing with the requirements of government regulations (% of senior management time) |\n| 14 | IC.LGL.CRED.XQ | Strength of legal rights index (0=weak to 12=strong) |\n| 15 | IC.REG.DURS.FE | Time required to start a business, female (days) |\n| 16 | IC.REG.DURS.MA | Time required to start a business, male (days) |\n| 17 | IC.TAX.TOTL.CP.ZS | Total tax and contribution rate (% of profit) |\n| 18 | IT.CEL.SETS.P2 | Mobile cellular subscriptions (per 100 people) |\n| 19 | IT.MLT.MAIN.P2 | Fixed telephone subscriptions (per 100 people) |\n| 20 | IT.NET.BBND.P2 | Fixed broadband subscriptions (per 100 people) |\n| 21 | LP.LPI.OVRL.XQ | Logistics performance index: Overall (1=low to 5=high) |\n| 22 | MS.MIL.XPND.GD.ZS | Military expenditure (% of GDP) |\n| 23 | NY.GDP.MKTP.KD.ZG | GDP growth (annual %) |\n| 24 | SE.PRM.TCAQ.ZS | Trained teachers in primary education (% of total teachers) |\n| 25 | SE.XPD.TOTL.GD.ZS | Government expenditure on education, total (% of GDP) |\n| 26 | SI.POV.GINI | GINI index (World Bank estimate) |\n| 27 | SI.POV.URHC | Urban poverty headcount ratio at national poverty lines (% of urban population) |\n| 28 | SL.TLF.CACT.FE.ZS | Labor force participation rate, female (% of female population ages 15+) (modeled ILO estimate) |\n| 29 | SL.TLF.CACT.MA.ZS | Labor force participation rate, male (% of male population ages 15+) (modeled ILO estimate) |\n| 30 | SL.UEM.TOTL.FE.ZS | Unemployment, female (% of female labor force) (modeled ILO estimate) |\n| 31 | SL.UEM.TOTL.MA.ZS | Unemployment, male (% of male labor force) (modeled ILO estimate) |\n| 32 | SP.URB.TOTL.IN.ZS | Urban population (% of total population) |\n| 33 | TX.VAL.TECH.MF.ZS | High-technology exports (% of manufactured exports) |\n\nThe \"keycode\" (e.g. TX.VAL.TECH.MF.ZS) can be used [on WorldBank search index](https://datacatalog.worldbank.org/search/indicators) to both see the metadata, the timeframe available, preview, and select other export options\n\n[dataset on my Kaggle profile](https://www.kaggle.com/robertolofaro/selected-indicators-from-world-bank-20002019)\n\n**POTENTIAL RESEARCH QUESTIONS COVERED** (the list of numbers is the indicator as per the list above, but it is just a sample- compounding and aggregation through a specific analysis model could actually use more or make irrelevant others)\n\nHow do you help cities adapt to a rapidly changing climate amidst a global pandemic, but do it in a way that is socially equitable? *3,4,5,6,8,15,16,18,24,25,26,27,28,29,30,31,32*\n\nWhat are the projects that can be invested in that will help pull cities out of a recession, mitigate climate issues, but not perpetuate racial/social inequities? *same as above, but focusing on \"delta\" (i.e. change impact, trend, acceleration/deceleration of change)*\n\nWhat are the practical and actionable points where city and corporate ambition join, i.e. where do cities have problems that corporations affected by those problems could solve, and vice versa? *1,2,7,11,13,14,21,23,33*\n\nHow can we measure the intersection between environmental risks and social equity, as a contributor to resiliency? *integrate the above with the data from the \"reference\" dataset within the context*", "votes": 1, "replies": [ { "id": 1064591, "postDate": "2020-10-30T09:43:00.490Z", "content": "incidentally: if you want a comparison of other datasets/KPIs/models on social impacts, a recent (2020-10-27) workshop from the National Academies, released yesterday on YouTube compares e.g. various Social Vulnerability Indicators and could give some ideas on which other elements/KPIs could be added to move from descriptive, to explanatory, to predictive models
\nthe title is about COVID-19 and vulnerability, but the latter is underlying any analysis of the former and its impacts
\nthe presentation page and link to video recording of the 3h workshop is here- free
", "rawMarkdown": "incidentally: if you want a comparison of other datasets/KPIs/models on social impacts, a **recent (2020-10-27) workshop from the National Academies, released yesterday on YouTube** compares e.g. various Social Vulnerability Indicators and could give some ideas on which other elements/KPIs could be added to move from descriptive, to explanatory, to predictive models\n\nthe title is about COVID-19 and vulnerability, but the latter is underlying any analysis of the former and its impacts\n\n[the presentation page and link to video recording of the 3h workshop is here- free](https://www.nationalacademies.org/event/10-27-2020/covid-19-and-the-geography-of-vulnerability)", "votes": 1 } ] }, { "id": 1060147, "postDate": "2020-10-25T20:38:45.530Z", "content": "Yearly Air Quality Index (AQI) For CDP Cities
\nThis dataset contains yearly averages of PM2.5 µg/m3 measurements for all of the cities disclosing to the CDP from 2000-2019.
\nMeasurements were obtained weather monitoring stations across the globe, the measurements for the city were obtained by identifying the station of closest proximity.
\nThe data was originally obtained from the Historical Air Quality dataset hosted on BigQuery (see dataset for more details) which contained a maintained air quality dataset provided by the EPA (https://www.epa.gov/).
\nPotential research questions - Can we come up with thresholds that indicate improvements in air quality? Should these thresholds be applied globally or regionally?
", "rawMarkdown": "[Yearly Air Quality Index (AQI) For CDP Cities](https://www.kaggle.com/reubencpereira/yearly-air-quality-index-aqi-for-cdp-cities)\n\nThis dataset contains yearly averages of PM2.5 µg/m3 measurements for all of the cities disclosing to the CDP from 2000-2019.\n\nMeasurements were obtained weather monitoring stations across the globe, the measurements for the city were obtained by identifying the station of closest proximity.\n\nThe data was originally obtained from the Historical Air Quality dataset hosted on BigQuery (see dataset for more details) which contained a maintained air quality dataset provided by the EPA (https://www.epa.gov/).\n\n**Potential research questions** - Can we come up with thresholds that indicate improvements in air quality? Should these thresholds be applied globally or regionally?\n", "votes": 1 }, { "id": 1059393, "postDate": "2020-10-25T03:24:29.330Z", "content": "Chronic Respiratory Disease Mortality Rates
\nThis data shows mortality rates due to chronic respiratory disease in the US by County (original source)
\nUse case: navigate further from City CDP survey data on what kind of projects or actions that the cities have made (environmental metrics changes) and how it is linked with mortality rates due to respiratory disease from this data (social metrics changes)
", "rawMarkdown": "[Chronic Respiratory Disease Mortality Rates](https://www.kaggle.com/rasyidstat/us-chronic-respiratory-disease-mortality-rates)\n\nThis data shows mortality rates due to chronic respiratory disease in the US by County (original [source](http://ghdx.healthdata.org/record/ihme-data/united-states-chronic-respiratory-disease-mortality-rates-county-1980-2014))\n\nUse case: navigate further from City CDP survey data on what kind of projects or actions that the cities have made (environmental metrics changes) and how it is linked with mortality rates due to respiratory disease from this data (social metrics changes)", "votes": 1 }, { "id": 1058176, "postDate": "2020-10-23T12:31:48.930Z", "content": "\nThis dataset shows the state and changes over time in the abstractions of freshwater resources in OECD countries
\n40 country and regions
Uploaded the water treatment data as well from the same source
", "rawMarkdown": "[Water Abstractions](https://www.kaggle.com/yaxin153537/cdp-external-data-source-water-supply/edit)\n\nThis dataset shows the state and changes over time in the abstractions of freshwater resources in OECD countries\n40 country and regions\n\nUploaded the water treatment data as well from the same source\n", "votes": 1, "replies": [ { "id": 1058358, "postDate": "2020-10-23T15:52:23.350Z", "content": "Great work! Your starter notebooks make it much easier for other Kagglers to quickly get started with the data. That being said, I think your dataset would get more usage and more visibility if you take the time to improve the usability rating for the two underlying datasets: https://www.kaggle.com/yaxin153537/water-supply and https://www.kaggle.com/yaxin153537/water-treatment. This involves adding a dataset description, an attribution section, and similar information.
\nThanks again for contributing these datasets they look like they could be very useful.
", "rawMarkdown": "Great work! Your starter notebooks make it much easier for other Kagglers to quickly get started with the data. That being said, I think your dataset would get more usage and more visibility if you take the time to improve the usability rating for the two underlying datasets: https://www.kaggle.com/yaxin153537/water-supply and https://www.kaggle.com/yaxin153537/water-treatment. This involves adding a dataset description, an attribution section, and similar information. \n\nThanks again for contributing these datasets they look like they could be very useful.", "votes": 1 }, { "id": 1059523, "postDate": "2020-10-25T07:46:49.917Z", "content": "Thanks a lot for the tips, Paul. will look into how to add those things.
", "rawMarkdown": "Thanks a lot for the tips, Paul. will look into how to add those things.", "votes": 2 } ] }, { "id": 1058108, "postDate": "2020-10-23T10:56:57.397Z", "content": "\nSome European Cities' pollution and drinking water access data from Eurostat
\n124 cities
Great work! Your starter notebooks make it much easier for other Kagglers to quickly get started with the data. That being said, I think your dataset would get more usage and more visibility if you take the time to improve the usability rating for the underlying dataset: https://www.kaggle.com/yaxin153537/eucities. This involves adding a dataset description, an attribution section, and similar information.
\nThanks again for contributing this public dataset!
", "rawMarkdown": "Great work! Your starter notebooks make it much easier for other Kagglers to quickly get started with the data. That being said, I think your dataset would get more usage and more visibility if you take the time to improve the usability rating for the underlying dataset: https://www.kaggle.com/yaxin153537/eucities. This involves adding a dataset description, an attribution section, and similar information. \n\nThanks again for contributing this public dataset!" } ] }, { "id": 1051984, "postDate": "2020-10-17T06:27:59.640Z", "content": "\nDoes a dataset shared on this thread count as an official submission, or is something else required for it to be considered for the competition?
\nSecondly, are BigQuery datasets hosted on Kaggle eligible?
", "rawMarkdown": "Hi @paultimothymooney,\n\nDoes a dataset shared on this thread count as an official submission, or is something else required for it to be considered for the competition?\n\nSecondly, are BigQuery datasets hosted on Kaggle eligible?", "votes": 1, "replies": [ { "id": 1052534, "postDate": "2020-10-17T21:22:14.020Z", "content": "If you post a public Kaggle dataset in this thread then it will be considered for the prize, there is not a separate submission form.
", "rawMarkdown": "If you post a public Kaggle dataset in this thread then it will be considered for the prize, there is not a separate submission form." } ] }, { "id": 1048796, "postDate": "2020-10-13T19:36:33.370Z", "content": "@paultimothymooney official competition dataset link is throwing 404.
Thank you for flagging the typo, the issue is now resolved.
", "rawMarkdown": "Thank you for flagging the typo, the issue is now resolved.", "votes": 1 } ] }, { "id": 1069773, "postDate": "2020-11-04T22:50:47.203Z", "content": "World City Daily Weather Data (2015-20)\n
\nhttps://www.kaggle.com/abhijitk/ghcn-daily-weather-data-by-city-20152020
\nThis dataset ontains daily weather data and nearest weather station coordinates of 10000+ cities from around the world.
\nI have generated this dataset by combining two publically available datasets on weather data and city coordinates and demographics. In a nutshell, it uses a city's coordinates to identify the nearest weather station and then extracts the historical daily weather data of this station. A dataset on weather patterns is generated by using the following open/public datasets:
\ni)**Global Historical Climatology Network (GHCN) (https://www.ncdc.noaa.gov/ghcn-daily-description):**
\n\"GHCN (Global Historical Climatology Network)-Daily is an integrated database of daily climate summaries from land surface stations across the globe. Like its monthly counterpart (GHCN-Monthly) , GHCN-Daily is comprised of daily climate records from numerous sources that have been integrated and subjected to a common suite of quality assurance reviews.GHCN-Daily contains records from over 100,000 stations in 180 countries and territories. NCEI provides numerous daily variables, including maximum and minimum temperature, total daily precipitation, snowfall, and snow depth; however, about one half of the stations report precipitation only. Both the record length and period of record vary by station and cover intervals ranging from less than a year to more than 175 years.
ii) **World Cities Database (https://simplemaps.com/data/world-cities):** A database of 26000 cities containing city names, geographical co-ordinates, population, density and country names. The database is available under Creative Commons Attribution 4.0 license.
\ni) Climate change is known to induce high global temperatures, changes in precipitation patterns, shortened frost/winter season, extreme weather events, heat waves, droughts etc.
\nii) Local data provides perspective: From NASAs Global Climate Change: \"…the extent of climate change effects on individual regions will vary over time and with the ability of different societal and environmental systems to mitigate or adapt to change.\" Hence, analysing localized weather patterns, population and changes over and around the cities participating in CDP surveys can provide perspective on adaptation and mitigation measures chosen by a city, infrastructure priorities, social equity programs and policies, gender biases, effect on health of the population etc. National level population and weather data may not account for local variations especially in large diverse countries like USA, China, India, Brazil etc. Hence, localized data is prefereable to national level data.
\niii) High Quality Measurable data: Weather and demographic data are primary, unbiased, recorded, historical data reflecting the on-ground situation. Local weather data like temperature, precipitation, snowfall etc. are regularly measured with quality assurances in place. Similarly, demographic data like population and density have been regularly measured for decades.
\niv) Unbiased: Other data types like projections, self reported data, extrapolations suffer from bias/assumptions of the reporter or analyst/estimator. Indices and basket/combination indicators suffer from biases in weightage given to different parameters. We need to be cautious while using projections, indices etc as they can inject existing biases in current analysis. Organizations and administrations can and are known to 'game' such indicators. Hence, it is preferable to use primary, unbiased and measurable data like weather and population demographics to build KPIs
\nThe dataset generated and the code in this notebook has applications beyond the current competition.
\ni) Ease of Access: The dataset makes climate data on thousands of cities instantly accessible through year-wise CSV files. Additionally , a 'key file' which links each city to the nearest weather station makes it easy to retrieve weather data with only the city and country name. It is presented in a human readable format. It can be easily manipulated using Python, R or even Microsoft Excel/ Google Sheets.
\nii) Scope and Usage The dataset covers thousands of cities beyond the CDP competition dataset. Hence, its potential uses extend to individuals and organizations engaged in sustainability, climate change, metereology etc. Although the notebook generates data for only the last 5 years, it can be modified further to obtain data for any other years from the NOAA database.
\niii) Size NOAA GHCN annual files sizes range from 1-2 GB. The extracted dataset files sizes are in the range of 150-200 MB i.e. almost 10-20% of the original files
\nI) Obtain files from NOAA and Simplemaps
\nII) Use the co-ordinates of each City and weather station to find the weather station closest to each city
\nIII) Extract the data for these weather stations and shape it in a human readable format.
\nWeather data on certain cities is missing or inaccurate because of the following reasons:
\ni) Some of the weather stations identified in the notebook are not polled by the NOAA in recent years. Hence, weather data on certain cities is missing.
\nii) In a few cases, the identified weather stations are very far from the respective cities.
\nPS: I will share the notebook with code for generating this data shortly.
", "rawMarkdown": "[World City Daily Weather Data (2015-20)\n](https://www.kaggle.com/abhijitk/ghcn-daily-weather-data-by-city-20152020)\n\nhttps://www.kaggle.com/abhijitk/ghcn-daily-weather-data-by-city-20152020\n\nThis dataset ontains **daily weather data and nearest weather station coordinates of 10000+ cities from around the world.**\n\nI have generated this dataset by combining two publically available datasets on weather data and city coordinates and demographics. In a nutshell, it uses a city's coordinates to identify the nearest weather station and then extracts the historical daily weather data of this station. A dataset on weather patterns is generated by using the following open/public datasets:\n\ni)**Global Historical Climatology Network (GHCN) (https://www.ncdc.noaa.gov/ghcn-daily-description):**\n\"GHCN (Global Historical Climatology Network)-Daily is an integrated database of daily climate summaries from land surface stations across the globe. Like its monthly counterpart (GHCN-Monthly) , GHCN-Daily is comprised of daily climate records from numerous sources that have been integrated and subjected to a common suite of quality assurance reviews.GHCN-Daily contains records from over 100,000 stations in 180 countries and territories. NCEI provides numerous daily variables, including maximum and minimum temperature, total daily precipitation, snowfall, and snow depth; however, about one half of the stations report precipitation only. Both the record length and period of record vary by station and cover intervals ranging from less than a year to more than 175 years.\n\nii) **World Cities Database (https://simplemaps.com/data/world-cities):** A database of 26000 cities containing city names, geographical co-ordinates, population, density and country names. The database is available under Creative Commons Attribution 4.0 license. \n\n## 1. Motivation: \n\ni) Climate change is known to induce high global temperatures, changes in precipitation patterns, shortened frost/winter season, extreme weather events, heat waves, droughts etc.\n\nii) **Local data provides perspective:** From NASAs Global Climate Change: \"...the extent of climate change effects on individual regions will vary over time and with the ability of different societal and environmental systems to mitigate or adapt to change.\" Hence, analysing localized weather patterns, population and changes over and around the cities participating in CDP surveys can provide perspective on adaptation and mitigation measures chosen by a city, infrastructure priorities, social equity programs and policies, gender biases, effect on health of the population etc. National level population and weather data may not account for local variations especially in large diverse countries like USA, China, India, Brazil etc. Hence, localized data is prefereable to national level data.\n\niii) **High Quality Measurable data:** Weather and demographic data are primary, unbiased, recorded, historical data reflecting the on-ground situation. Local weather data like temperature, precipitation, snowfall etc. are regularly measured with quality assurances in place. Similarly, demographic data like population and density have been regularly measured for decades. \n\niv) **Unbiased:** Other data types like projections, self reported data, extrapolations suffer from bias/assumptions of the reporter or analyst/estimator. Indices and basket/combination indicators suffer from biases in weightage given to different parameters. We need to be cautious while using projections, indices etc as they can inject existing biases in current analysis. Organizations and administrations can and are known to 'game' such indicators. Hence, it is preferable to use primary, unbiased and measurable data like weather and population demographics to build KPIs\n\n## 2. Advantages: \n\nThe dataset generated and the code in this notebook has applications beyond the current competition. \n\ni) **Ease of Access:** The dataset makes climate data on thousands of cities instantly accessible through year-wise CSV files. Additionally , a 'key file' which links each city to the nearest weather station makes it easy to retrieve weather data with only the city and country name. It is presented in a human readable format. It can be easily manipulated using Python, R or even Microsoft Excel/ Google Sheets.\n\nii) **Scope and Usage** The dataset covers thousands of cities beyond the CDP competition dataset. Hence, its potential uses extend to individuals and organizations engaged in sustainability, climate change, metereology etc. Although the notebook generates data for only the last 5 years, it can be modified further to obtain data for any other years from the NOAA database. \n\niii) **Size** NOAA GHCN annual files sizes range from 1-2 GB. The extracted dataset files sizes are in the range of 150-200 MB i.e. almost 10-20% of the original files\n\n## 3. Method\n\nI) Obtain files from NOAA and Simplemaps\n\nII) Use the co-ordinates of each City and weather station to find the weather station closest to each city\n\nIII) Extract the data for these weather stations and shape it in a human readable format.\n\n\n## 4. Limitations:\n\nWeather data on certain cities is missing or inaccurate because of the following reasons:\n\ni) Some of the weather stations identified in the notebook are not polled by the NOAA in recent years. Hence, weather data on certain cities is missing.\n\nii) In a few cases, the identified weather stations are very far from the respective cities.\n\n\nPS: I will share the notebook with code for generating this data shortly.", "votes": 2, "replies": [ { "id": 1069783, "postDate": "2020-11-04T23:39:04.693Z", "content": "Notebook showing dataset generation:
\nhttps://www.kaggle.com/abhijitk/extracting-weather-data-from-city-coordinates
Downloaded from here, a global dataset of carbon footprints at a 250m spatial resolution (see download link for GeoTIFF files on that page), presented in a 2018 paper Carbon footprints of 13 000 cities. The footprints are calculated based on economic activity using a \"top down\" approach, as opposed to direct measurements of emissions or \"bottom up\" inventories.
\nHere are some quotes from the authors stating why they did what they did:
\n\n\nwhile reporting standards are emerging (e.g. Carbon Disclosure Project 2016) for conducting such assessments, individual city inventories are generally neither comparable nor comprehensive … Furthermore, for most cities no carbon footprint estimate exists.
\n
and how:
\n\n\nIn order to examine the spatial distribution of carbon footprints at the household level, we developed a top-down, globally consistent gridded model. The model uses gridded population and income data to disaggregate existing subnational carbon footprint models for the US, China, Europe, the UK, and Japan, and national data for other countries.
\n
These data seem relevant to this competition for several reasons. The authors note \"individual city inventories are generally neither comparable nor comprehensive\", meaning these data may be useful:
\nAt a more technical level:
\nI plan to build out the notebook for this dataset to improve the integration with the competition data. Hope you find it useful and thanks for sharing your data here!
", "rawMarkdown": "#[Global Gridded Model of Carbon Footprints (GGMCF)](https://www.kaggle.com/klostest/global-gridded-model-of-carbon-footprints-ggmcf)\n\nDownloaded from [here](http://citycarbonfootprints.info/), a global dataset of carbon footprints at a 250m spatial resolution (see download link for GeoTIFF files on that page), presented in a 2018 paper [Carbon footprints of 13 000 cities](https://iopscience.iop.org/article/10.1088/1748-9326/aac72a). The footprints are calculated based on economic activity using a \"top down\" approach, as opposed to direct measurements of emissions or \"bottom up\" inventories.\n\nHere are some quotes from the authors stating why they did what they did:\n\n>while reporting standards are emerging (e.g. Carbon Disclosure Project 2016) for conducting such assessments, individual city inventories are generally neither comparable nor comprehensive ... Furthermore, for most cities no carbon footprint estimate exists.\n\nand how:\n\n>In order to examine the spatial distribution of carbon footprints at the household level, we developed a top-down, globally consistent gridded model. The model uses gridded population and income data to disaggregate existing subnational carbon footprint models for the US, China, Europe, the UK, and Japan, and national data for other countries.\n\nThese data seem relevant to this competition for several reasons. The authors note \"individual city inventories are generally neither comparable nor comprehensive\", meaning these data may be useful:\n\n- As an attempt at a \"ground truth\". Cities can self-report emissions, both direct and indirect, to CDP through the questionnaire we are given responses to, which look like they're based on bottom-up inventories. However it seems valuable to have external verification of these self-reported data.\n- To see how cities' aspirations and policies, as reported to CDP, align with the need to reduce emissions based on a comprehensive global inventory. Such a comparison may indicate which cities have the most dire need of creating more aggressive policies, if their policies are not commensurate with their footprint, and may point the way to useful KPIs for cities.\n\nAt a more technical level:\n\n- The spatial grain of the dataset (250m) means that cities should be individually identifiable in terms of their carbon footprint, as opposed to coarser grained spatial data at 0.5 or 1 degree resolution (1° = 111 km at the equator). In theory every city in the CDP data should be able to be spatially joined to these footprint data and [I've started a notebook](https://www.kaggle.com/klostest/external-data-global-carbon-footprints-250m-grid#Dataset-description-and-relation-to-competition) showing how an urban area (LA County) can be located within the dataset.\n- The fine spatial resolution also allows within-city analysis, creating the potential to build upon the example given in the starter notebook showing within-city socioeconomic data in New York and how this may be tied in to sustainability KPIs.\n\nI plan to build out the notebook for this dataset to improve the integration with the competition data. Hope you find it useful and thanks for sharing your data here!", "votes": 2 }, { "id": 1068919, "postDate": "2020-11-03T21:47:31.883Z", "content": "Environmetal Justice in Berlin City
\nThis dataset can be used to investigate how Berlin measures 5 different KPIs to investigare environmental and social issues.
\nMost current datasets focus on environmental and social factors on a global scale, while these trends can also be captures on a city level, which may be more comparable then between different regions with different backgrounds.
\nIt may be interesting to also capture trends on a city scale and investigate wether these are also prevalent on a global / national scale or how they differ.
\nI have standardised and transformed the dataset to a numerical representation from German language to be more accessible and easier to handle.
", "rawMarkdown": "[Environmetal Justice in Berlin City](https://www.kaggle.com/jpbremer/environmental-justice-in-berlin-city)\n\nThis dataset can be used to investigate how Berlin measures 5 different KPIs to investigare environmental and social issues. \n\nMost current datasets focus on environmental and social factors on a global scale, while these trends can also be captures on a city level, which may be more comparable then between different regions with different backgrounds.\n \nIt may be interesting to also capture trends on a city scale and investigate wether these are also prevalent on a global / national scale or how they differ. \n\nI have standardised and transformed the dataset to a numerical representation from German language to be more accessible and easier to handle. ", "votes": 2 }, { "id": 1068890, "postDate": "2020-11-03T21:15:05.270Z", "content": "
This dataset contains a selection of resources from SEDAC, the SocioEconomic Data & Applications Center. SEDAC is part of NASA's Earth Observing System Data and Information System, and this data was originally hosted by CIESIN at Columbia University, here.
\nThere are 8 individual datasets, separated into subdirectories and which include full dataset explanations. All sources are fully attributed. Since there is a range of unfamiliar datatypes, and because the data itself can be organised messily, I have included a comprehensive starter kernel here: https://www.kaggle.com/bigironsphere/sedac-introduction-how-to-work-with-this-dataset
\nThe datasets are:
\nI have chosen these as they provide insight into environmental and social factors that are known to disproportionally affect lower socioeconomic groups, and are therefore of key value in assessing how to achieve sustainable development on both a global and regional basis that also helps to combat the effects of inequality. I have tried to prioritise data that is more recent. The geospatial data is especially useful for visualisation, and I have also provided functions in the introductory notebook that allow it to be mapped to any coordinates for city and company locations.
\nI hope this dataset is of use to you in the competition!
", "rawMarkdown": "## [SocioEconomic Data & Applications Center (SEDAC)](https://www.kaggle.com/bigironsphere/socioeconomic-data-and-applications-center)\n\n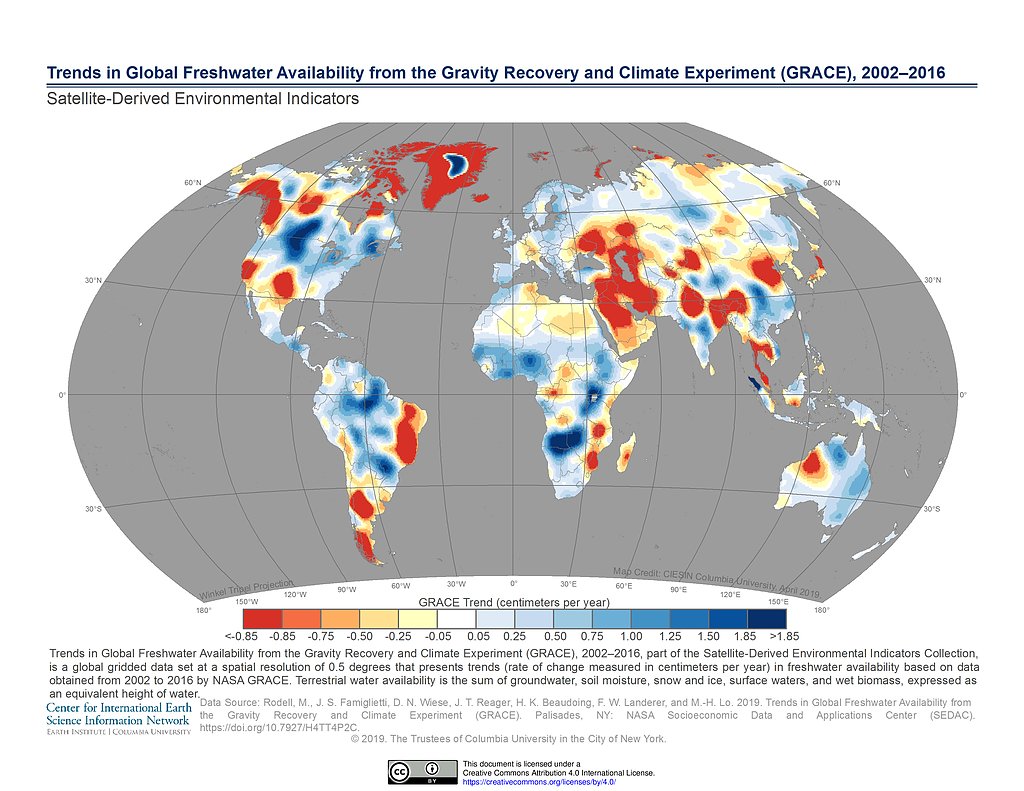\n\nThis dataset contains a selection of resources from SEDAC, the SocioEconomic Data & Applications Center. SEDAC is part of NASA's Earth Observing System Data and Information System, and this data was originally hosted by CIESIN at Columbia University, [here](https://sedac.ciesin.columbia.edu/data/sets/browse). \n\nThere are 8 individual datasets, separated into subdirectories and which include full dataset explanations. All sources are fully attributed. Since there is a range of unfamiliar datatypes, and because the data itself can be organised messily, I have included a comprehensive starter kernel here: https://www.kaggle.com/bigironsphere/sedac-introduction-how-to-work-with-this-dataset\n\nThe datasets are:\n\n1. **1x1 Gridded Emissions**\n2. **Trends in Global Freshwater Availability**\n3. **Development Threat Index**\n4. **Environmental Performance Index**\n5. **Climate Effects on Food Supply**\n6. **Human Modification of Terrestrial Systems**\n7. **Global Annual PM2.5 Grids**\n8. **Natural Resource Protection & Child Health Indicators**\n\nI have chosen these as they provide insight into environmental and social factors that are known to disproportionally affect lower socioeconomic groups, and are therefore of key value in assessing how to achieve sustainable development on both a global and regional basis that also helps to combat the effects of inequality. I have tried to prioritise data that is more recent. The geospatial data is especially useful for visualisation, and I have also provided functions in [the introductory notebook](https://www.kaggle.com/bigironsphere/sedac-introduction-how-to-work-with-this-dataset) that allow it to be mapped to any coordinates for city and company locations.\n\nI hope this dataset is of use to you in the competition!\n", "votes": 2 }, { "id": 1068289, "postDate": "2020-11-03T08:49:18.027Z", "content": "Annual Financial Data For Hybrid Metrics
\nThis dataset enables the invention of KPI that combines financial performance and environmental, social impact.
\n I collected the corporate annual financial statements and attached the key to join the CDP dataset. The gathered financial data follows the report from Shared Value Initiative about Hybrid Metrics.
I'll add a notebook that guides how to use this dataset. It'll be useful for the final goal of this competition.
", "rawMarkdown": "[Annual Financial Data For Hybrid Metrics](https://www.kaggle.com/takahirokubo0/annual-financial-data-for-hybrid-cdp-kpi)\n\nThis dataset enables the invention of KPI that combines financial performance and environmental, social impact. \n I collected the corporate annual financial statements and attached the key to join the CDP dataset. The gathered financial data follows the report from [ Shared Value Initiative about Hybrid Metrics](https://www.sharedvalue.org/resource/hybrid-metrics/).\n\nI'll add a notebook that guides how to use this dataset. It'll be useful for the final goal of this competition.", "votes": 2 }, { "id": 1067999, "postDate": "2020-11-03T00:52:46.637Z", "content": "Use of safely managed drinking water services
\nThis dataset focuses on the percent of population for a country using safely managed drinking water services. I think this dataset will be useful for addressing the water supply issue as well as social inequalities. I have also included a notebook to show how to get started with the dataset. I hope others find it useful!
", "rawMarkdown": "[Use of safely managed drinking water services](https://www.kaggle.com/alexander256/use-of-safely-managed-drinking-water-services)\n\nThis dataset focuses on the percent of population for a country using safely managed drinking water services. I think this dataset will be useful for addressing the water supply issue as well as social inequalities. I have also included a notebook to show how to get started with the dataset. I hope others find it useful!", "votes": 2 }, { "id": 1055836, "postDate": "2020-10-21T06:45:28.223Z", "content": "World Income Inequality Database
\nThe UNU-WIDER World Income Inequality Database (WIID) provides information on income inequality for 189 developed, developing, and transitioning countries (including historical entities) in an organized and user-friendly manner
", "rawMarkdown": "[World Income Inequality Database](https://www.kaggle.com/mannmann2/world-income-inequality-database)\n\nThe UNU-WIDER World Income Inequality Database (WIID) provides information on income inequality for 189 developed, developing, and transitioning countries (including historical entities) in an organized and user-friendly manner", "votes": 2, "replies": [ { "id": 1058350, "postDate": "2020-10-23T15:46:21.743Z", "content": "Thank you for contributing this public dataset and for making sure that your dataset has a high usability rating. This looks great! A few small changes you could make that I think would make the dataset even better would be if you: (1) update the datatset metadata or overview page to contain the URL that points to the original source; and (2) if it contained an introductory notebook to make it easy to quickly get started with the data (i.e. overview of dataset structure, how to load files, quick preview of dataset contents, etc).
\nThanks again for contributing such a great public dataset!
", "rawMarkdown": "Thank you for contributing this public dataset and for making sure that your dataset has a high usability rating. This looks great! A few small changes you could make that I think would make the dataset even better would be if you: (1) update the [datatset metadata](https://www.kaggle.com/mannmann2/world-income-inequality-database/metadata) or [overview](https://www.kaggle.com/mannmann2/world-income-inequality-database) page to contain the URL that points to the original source; and (2) if it contained an introductory notebook to make it easy to quickly get started with the data (i.e. overview of dataset structure, how to load files, quick preview of dataset contents, etc).\n\nThanks again for contributing such a great public dataset!", "votes": 1 }, { "id": 1059068, "postDate": "2020-10-24T15:18:37.967Z", "content": "Thank you for the feedback!
", "rawMarkdown": "Thank you for the feedback!", "votes": 1 } ] }, { "id": 1054219, "postDate": "2020-10-19T19:11:49.333Z", "content": "Datasets I found useful so far:
\n1 - Air Pollution (WHO)
\nDataset covers 4498 cities and 108 countries, many of them also present in the CDP datasets. Air quality is measured with annual mean concentrations particulate matter (PM10 or PM2.5) concentrations from 2008 to 2017. Data descriptor notebook here.
2 - COVID-19 Community Mobility Reports (Google)
\nThe pandemic context brings new challenges to cities. This fantastic resource was created by Google with aggregated, anonymized sets of data from users who have turned on the Location History setting on Android. It captures the changes in mobility between baseline values (median value from the 5‑week period Jan 3 – Feb 6, 2020) at weekly intervals data from February to October 2020. Data include changes in mobility related to workplace, residential, transit hubs, parks, retail and grocery. It covers 593 cities in 43 countries. Kernel is here
3 - Income Group and Inequalities (World Bank)
\nThe World Bank classifies the world's economies into four income groups — high, upper-middle, lower-middle, and low. The dataset contain the 2020 classification on 264 countries. Gini index which measures inequalities is also available from 2011 to 2020 for a set of countries. Starter notebook here
4 - Access to Basic Services (UN Habitat)
\nContains three datasets: a) % of population with access to public transports, b) % access to basic services and c) % population living in slums from 1990 to 2018. Covers 1216 cities from 115 countries. Starter notebook
5 - Ease of Doing Business (World Bank)
\nEase of doing business is an index published by the World Bank. It is an aggregate figure of a country scores on 10 topics and Economies are ranked from 1–190. Dataset contains 213 countries and span the different metrics used to construct the index for 2018, 2019 and 2020. Electricity reliability, outage durations, cost are particularly interesting for the CDP challenge (linkages with energy, transport, etc). Starter notebook here
6 - GHG emissions (CDP)
\nDataset from CDP but not included initially. Annual city-wide emissions for 44 cities. Includes GHG emission with information about how cities measured emissions, as well as why emissions rose/fell since prior reporting period
Great work! A few suggestions: (1) it looks like Access to Basic Services (UN Habitat) and Income Group and Inequalities (World Bank) are both private you should make sure to flip the privacy setting to \"public\" as soon as possible; (2) Air Pollution (WHO) and Ease of Doing Business (World Bank) could be improved by adding a \"dataset description\" section and by improving the dataset usability rating; and (3) just noting that I think that the most useful datasets tend to be datasets that have introductory notebooks that make it easy to quickly get started with the data (overview of dataset structure, how to load files, quick preview of dataset contents, etc).
\nThanks again for contributing these public datasets!
", "rawMarkdown": "Great work! A few suggestions: (1) it looks like [Access to Basic Services (UN Habitat)](https://www.kaggle.com/fkosmowski/city-access-to-basic-services) and [Income Group and Inequalities (World Bank)](https://www.kaggle.com/fkosmowski/country-income-and-inequalities) are both private you should make sure to flip the privacy setting to \"public\" as soon as possible; (2) [Air Pollution (WHO) ](https://www.kaggle.com/fkosmowski/ambient-air-quality-database/) and [Ease of Doing Business (World Bank)](https://www.kaggle.com/fkosmowski/cdp-ease-of-doing-business/) could be improved by adding a \"dataset description\" section and by improving the dataset usability rating; and (3) just noting that I think that the most useful datasets tend to be datasets that have introductory notebooks that make it easy to quickly get started with the data (overview of dataset structure, how to load files, quick preview of dataset contents, etc).\n\nThanks again for contributing these public datasets!", "votes": 1 } ] }, { "id": 1052700, "postDate": "2020-10-18T06:51:08.983Z", "content": "Linked below is a global air quality dataset by Open AQ. It includes 5490 locations from 47 countries, is updated weekly and may be useful in correlating emissions data with the overall air quality in a city.
\nhttps://www.kaggle.com/open-aq/openaq
", "rawMarkdown": "Linked below is a global air quality dataset by Open AQ. It includes 5490 locations from 47 countries, is updated weekly and may be useful in correlating emissions data with the overall air quality in a city.\n\nhttps://www.kaggle.com/open-aq/openaq", "votes": 2, "replies": [ { "id": 1052705, "postDate": "2020-10-18T06:57:20.890Z", "content": "Also sharing a notebook containing examples on how to query the historical data.
\nhttps://www.kaggle.com/mhajabri/air-pollution-101
", "rawMarkdown": "Also sharing a notebook containing examples on how to query the historical data.\n\nhttps://www.kaggle.com/mhajabri/air-pollution-101", "votes": 1 } ] }, { "id": 1059664, "postDate": "2020-10-25T10:27:29.257Z", "content": "\nDaily cases of covid-19 by 211 countries and territories from European Union Open Data Portal
\nFrom 31Dec2019 to 24Oct2020
\nIt also includes deaths, Cumulative case of 14 days per 1m people and the population of the countries
A consistent, standardized, GIS-based estimate of consumer carbon footprint for 13,000 locations on Earth, including in nearly every country (they even have Iran). Data is in the form of a Mollweide Projection, whole Earth form, NTSI code 54009: http://citycarbonfootprints.info/ Additional details about the methodology of the study and its topological character can be found in the Scientific American article about this study: https://www.scientificamerican.com/article/heres-how-much-cities-contribute-to-the-worlds-carbon-footprint/ Although I have not specifically checked, I would be highly surprised if any of the cities in the CDP set are not in this collection, as it includes nearly all cities and even significant towns within the represented countries, which is most of the countries in the world and as far as I know all industrialized countries.
\nData is in the form of a GeoTIFF file, which can be analyzed in Python using the Georasters or Rasterio packages, or in R using the Raster package, as well as any GIS package. A separate GeoTIFF file is also available for per capita consumer carbon footprint. A text file with the emissions for the top 100 cities is also provided to assist with debugging. This form of the Mollweide Projection does not appear to be available in Pyproj for coordinate conversion, but details about converting between Mollweide coordinates and Lattitude/Longitude are provided in this Wikipedia page: https://en.wikipedia.org/wiki/Mollweide_projection
", "rawMarkdown": "A consistent, standardized, GIS-based estimate of consumer carbon footprint for 13,000 locations on Earth, including in nearly every country (they even have Iran). Data is in the form of a Mollweide Projection, whole Earth form, NTSI code 54009: http://citycarbonfootprints.info/ Additional details about the methodology of the study and its topological character can be found in the Scientific American article about this study: https://www.scientificamerican.com/article/heres-how-much-cities-contribute-to-the-worlds-carbon-footprint/ Although I have not specifically checked, I would be highly surprised if any of the cities in the CDP set are not in this collection, as it includes nearly all cities and even significant towns within the represented countries, which is most of the countries in the world and as far as I know all industrialized countries. \n\nData is in the form of a GeoTIFF file, which can be analyzed in Python using the Georasters or Rasterio packages, or in R using the Raster package, as well as any GIS package. A separate GeoTIFF file is also available for per capita consumer carbon footprint. A text file with the emissions for the top 100 cities is also provided to assist with debugging. This form of the Mollweide Projection does not appear to be available in Pyproj for coordinate conversion, but details about converting between Mollweide coordinates and Lattitude/Longitude are provided in this Wikipedia page: https://en.wikipedia.org/wiki/Mollweide_projection " }, { "id": 1068824, "postDate": "2020-11-03T19:15:25.377Z", "content": "\nI have compiled a set of datasets which -I believe- could be supplementary to the CDP survey data. I hope it will be useful to all of us!
", "rawMarkdown": "[Datasets for CDP competition](https://www.kaggle.com/aslates/cdp-datasets)\n\nI have compiled a set of datasets which -I believe- could be supplementary to the CDP survey data. I hope it will be useful to all of us! ", "replies": [ { "id": 1068835, "postDate": "2020-11-03T19:35:36.353Z", "content": "These look great! You may find that your dataset will get more usage and more visibility if you improve the usability rating a bit (e.g. data license, banner image, starter notebook, etc).
", "rawMarkdown": "These look great! You may find that your dataset will get more usage and more visibility if you improve the usability rating a bit (e.g. data license, banner image, starter notebook, etc).", "votes": 1 }, { "id": 1068883, "postDate": "2020-11-03T21:10:14.750Z", "content": "Thanks for the feedback!
", "rawMarkdown": "Thanks for the feedback!", "votes": 1 } ] }, { "id": 1058341, "postDate": "2020-10-23T15:38:58.900Z", "content": "\nThis is the original data source from WRI to calculate water shadow price.
\nThanks for the lead in the cdp_starter_notebook.
It has csv format as well as geo format. will be powerful on the illustration.
", "rawMarkdown": "[Water Shadow Price](https://www.kaggle.com/yaxin153537/shadow-price-for-water/edit)\n\nThis is the original data source from WRI to calculate water shadow price. \nThanks for the lead in the cdp_starter_notebook.\n\nIt has csv format as well as geo format. will be powerful on the illustration. ", "replies": [ { "id": 1058360, "postDate": "2020-10-23T15:54:14.380Z", "content": "I think your datasets will get more usage and more visibility if you improve the usability rating for the four underlying datasets: https://www.kaggle.com/yaxin153537/gpkg-file-annual-baseline, https://www.kaggle.com/yaxin153537/projection-shp, https://www.kaggle.com/yaxin153537/report, and https://www.kaggle.com/yaxin153537/wridata. This involves adding a dataset description, an attribution section, and similar information.
\nThanks again for contributing these datasets they look like they could be very useful!
", "rawMarkdown": "I think your datasets will get more usage and more visibility if you improve the usability rating for the four underlying datasets: https://www.kaggle.com/yaxin153537/gpkg-file-annual-baseline, https://www.kaggle.com/yaxin153537/projection-shp, https://www.kaggle.com/yaxin153537/report, and https://www.kaggle.com/yaxin153537/wridata. This involves adding a dataset description, an attribution section, and similar information. \n\nThanks again for contributing these datasets they look like they could be very useful!" } ] }, { "id": 1087278, "postDate": "2020-11-22T15:09:51.313Z", "rawMarkdown": "", "isDeleted": true }, { "id": 1067015, "postDate": "2020-11-02T09:55:46.537Z", "rawMarkdown": "", "isDeleted": true }, { "id": 1066329, "postDate": "2020-11-01T16:09:42.967Z", "rawMarkdown": "", "votes": 1, "isDeleted": true, "replies": [ { "id": 1066439, "postDate": "2020-11-01T19:03:07.297Z", "content": "This looks great! Don't forget to also include an attribution section with links to the original sources
", "rawMarkdown": "This looks great! Don't forget to also include an attribution section with links to the original sources" }, { "id": 1067546, "postDate": "2020-11-02T15:25:06.240Z", "rawMarkdown": "", "votes": 1, "isDeleted": true } ] }, { "id": 1055156, "postDate": "2020-10-20T14:22:39.467Z", "rawMarkdown": "", "votes": 1, "isDeleted": true, "replies": [ { "id": 1055199, "postDate": "2020-10-20T15:09:30.653Z", "content": "If you download data from an external API, it is best to upload it as a public Kaggle Dataset (in accordance with the data license for that specific dataset). This prevents the data from disappearing from your notebook after your access token expires (for example, with the Earth Engine API your data will disappear after 48 hours -- for an example, see this notebook). It also lowers the barrier to access for other Kagglers (no need for a separate login + access token + authentication workflow) and also it will load into Kaggle Notebooks much more quickly (no need to download the data every time, it will remain cached on Kaggle's servers, etc).
", "rawMarkdown": "If you download data from an external API, it is best to upload it as a public Kaggle Dataset (in accordance with the data license for that specific dataset). This prevents the data from disappearing from your notebook after your access token expires (for example, with the Earth Engine API your data will disappear after 48 hours -- for an example, see [this notebook](https://www.kaggle.com/paultimothymooney/plot-no2-emissions-data-from-earth-engine/notebook)). It also lowers the barrier to access for other Kagglers (no need for a separate login + access token + authentication workflow) and also it will load into Kaggle Notebooks much more quickly (no need to download the data every time, it will remain cached on Kaggle's servers, etc).\n" }, { "id": 1055736, "postDate": "2020-10-21T04:12:36.037Z", "rawMarkdown": "", "votes": 1, "isDeleted": true } ] } ], "comments": [ { "id": 1065814, "author_name": "David 289", "author_url": "", "post_date": "2020-10-31T19:53:28.860000", "content": "ND-GAIN: Urban Adaptation Assessment
\nHey there,
\nI found this dataset from ND-GAIN extremely useful. It includes climate risk hazards by city linked to extreme temperature fluctuations, drought, floods and rising sea levels for the United States.
\nI think that the data and the research from ND-GAIN is really relevant for this project and is really worth looking at.
The Storm Events Database is an integrated database of severe weather events across the United States, with information about a storm event's location, azimuth, distance, impact, and severity, including the cost of damages to property and crops. It contains data documenting:
\nThe Kaggle datasets contain information for storms and tornadoes that hit the U.S. between-2013 till 2020 and has been collected from the National Oceanic And Atmospheric Administration's Storm Events database hosted on Google BigQuery: https://console.cloud.google.com/marketplace/product/noaa-public/severe-storm-events?project=scenic-helper-291002
\nThere is a lot of existing literature exploring the possibility of a linkage between rising greenhouse gas emissions and extreme weather events. I think this dataset can be combined with the existing CDP data to test if there could be an association between severe storms and emissions (extrapolated from the cities/corporations responses) in the U.S.
", "votes": 3, "replies": [] }, { "id": 1069576, "author_name": "CatheTorres", "author_url": "", "post_date": "2020-11-04T16:08:01.123000", "content": "An increasing amount of high-resolution global spatial data are available and used for various assessments. However, key environmental and socioeconomic indicators are still mainly provided only at national level. Instead, it would be beneficial to adopt data for sub-national administrative units where available, supplemented by national data where necessary. To this end, this dataset present a compilation of several vector and raster (gridded) data sources, presenting relevant environmental and socioeconomic variables, such as the world population and GDP per 250 m grid, deforestation, air temperature, solar energy potential, among others.
\nThe data are divided into 12 folders:
\n1. Cities and towns (points and polygons) \n2. Roads and railroads\n3. Airports and ports\n4. Power plants\n5. Gridded Population 2015 (250 m)\n6. Gridded Gross Domestic Product and Human Development Index over 1990-2015 \n7. Gridded Land cover 2015\n8. Tree Cover Loss by Dominant Driver\n9. Carbon accumulation potential from natural forest regrowth in forest and savanna biomes\n10. Solar energy potential\n11. Air temperature\n12. Global cattle distribution in 2010 (5 minutes of arc)\nI believe that this dataset can be very useful for the CDP competition, both to assist in analyzing the consistency of the questionnaire data, and to provide data for environmental and socioeconomic indicators.
\nI hope it helps!
Aqueduct GlobalMaps 3.0 Baseline Annual Water Risk
\nThis database enables comparison of water-related risks across large geographies to identify regions or assets deserving of closer attention. Aqueduct 3.0 introduces a water risk framework and new and improved indicators. It also features different hydrological sub-basins. We introduce indicators based on a new hydrological model that now features (1) integrated water supply and demand, (2) surface water and groundwater modelling, (3) higher spatial resolution, and (4) a monthly time series that enables the provision of monthly scores for selected indicators.
", "votes": 3, "replies": [] }, { "id": 1067661, "author_name": "seraphimstreets", "author_url": "", "post_date": "2020-11-02T16:08:48.237000", "content": "Compiled datasets for CDP Analytics Competition
\nA collection of 20 datasets related to this competition. (Not sure whether this is allowed) Based off my reading, I felt that the problem statement was intentionally extremely broad in scope, addressing:
\nSo in compiling this list, I tried to capture as many of these aspects as possible, both in terms of breadth and depth. I've also organized them by topic to boost its usability if anyone should find it helpful for their work. Some highlights of this set include:
\n1 - Green Growth Indicators by Country (OECD)
\nContains quantifiable metrics on a country's environmental approach from 1990 to 2019, for instance \"Production-based CO2 intensity\", \"Development of environment-related technologies, % all technologies\", \"Environmentally related taxes, % GDP\", \"Environmentally related government R&D budget, % total government R&D\" and more. I think this will be useful as the quantitative counterpart to the qualitative data provided by CDP, since government bureaucrats are incentivized to paint a better picture to some extent, and this can be used as a \"check and balance\" against that.
\n2 - Social Equity datasets at the regional level (OECD)
\nWhen exploring inequity caused by climate change, I think it is equally, if not even more, important that we study its impacts at the regional over country level. A topical example would be the decline of the manufacturing jobs in the Rust Belt in the US due to her reduced reliance on fossil fuels. So these datasets cover large regions (TL2) of every country and measure certain indicators of inequity, such as unemployment, GDP and education. I think it may be interesting to juxtapose these with another attached dataset \"Renewable Jobs by Country\" (IRENA) to see how each region compares to the national performance, and whether factors such as educational attainment may be a viable predictor.
\n3 - Corporate Knights' Top 100 Sustainable Companies 2020 (Corporate Knights)
\nCorporate Knights is an award-winning media, research and financial information products company based in Toronto, focused on promoting \"clean capitalism\" where market actors actively manage the environmental impacts of their business. They publish an annual Top 100 list of companies who have demonstrated their efficacy in being environmental and socially conscious (with greater emphasis on environment) while maintaining a respectable level of profitability. (gross revenue of more than $1 billion in the economic year) Features include the companies' Energy/Carbon/VOC/PM productivities, the companies' sector and country of origin, and social metrics such as sustainability paylink and %women on the board. It is difficult to find open-source datasets on the environmental measures taken by individual companies, since much of this data is behind paywalls. Hopefully, by combining this with datasets on government environmental taxes/policies, some insight can be gained on the intersection of corporate and environmental interests.
\n4 - Statistical costs of premature deaths due to environmental risks by country (OECD)
\nOECD has helpfully compiled a list of the statistical costs of deaths caused by environmental risks such as particulate matter, ozone, unsafe sanitation etc. for every country from 1990 to 2017. This could provide useful insights on the intersection between economic and environmental degradation, as well as inequities on the country level. If this dataset proves too granular, there are also more manageable datasets which directly compare a country's GDP growth with its PM2.5 reading, and its PM2.5 reading with PM-pollution deaths.
\nOther datasets:
\nGDP vs Pollution rates by country (Our World in Data)
\nDeaths by Particulate Matter Air Pollution vs PM25 by country (Our World in Data)
\nCO2 emissions by country (Our World in Data)
\nClimate Vulnerability and Readiness 2015 (ClimateWatch)
\nGINI by country (OECD)
\nRenewable Energy Jobs by Country (IRENA)
\nPercentage of Energy Consumption Global (Our World in Data)
\nFossil Fuel Prices (1989-2019) (BP Statistical Review of World Energy)
\nWRI Sustainable Fiananciing 2019 (World Resource Institute)
\nRenewable Energy Statistics (2010-2019) (IRENA)
My hope is that some of these datasets may assist Kagglers in their data analysis journeys and provide valuable insights to safeguard future generations from the impacts of climate change. Thank you.
", "votes": 3, "replies": [ { "id": 1067886, "author_name": "Paul Mooney", "author_url": "", "post_date": "2020-11-02T19:47:47.857000", "content": "This looks great! Although if you also include the URLs of the original sources then this would make the attributions section more complete.
", "votes": 0, "replies": [] }, { "id": 1068266, "author_name": "seraphimstreets", "author_url": "", "post_date": "2020-11-03T08:12:41.407000", "content": "Okay, fixed. Thanks!
", "votes": 0, "replies": [] } ] }, { "id": 1059064, "author_name": "Arman", "author_url": "", "post_date": "2020-10-24T15:10:56.457000", "content": "World Bank Poverty and Equity Database
\nLatest poverty and inequality indicators compiled from officially recognized international sources. Poverty indicators include the poverty headcount ratio, poverty gap, and number of poor at both international and national poverty lines. Inequality indicators include the Gini index and income or consumption distributions. The database includes national, regional and global estimates.
", "votes": 3, "replies": [ { "id": 1065187, "author_name": "AlexFromIdaho", "author_url": "", "post_date": "2020-10-31T01:53:30.957000", "content": "A thought occurs to me: one big flaw of a lot of city planning approaches (and unfortunately, Green approaches are often even worse in this regard than most) is the overfocus on the local at the expense of the regional or even the county level. \"We will increase property values, utilization et cetera in THIS NEIGHBORHOOD and not even care what happens to the larger region.\" With that in mind, maybe the fact that this is NOT broken down at the city level is actually a feature rather than a bug.
", "votes": 0, "replies": [] } ] }, { "id": 1065826, "author_name": "Adam S", "author_url": "", "post_date": "2020-10-31T20:33:45.790000", "content": "Climate Watch: Data for Climate Action
\nVery helpful dataset from the Climate Watch Platform. It includes historical emissions by country, region, industry, and gas by year (1850-2018). Additionally, it covers Nationally Determined Contributions (NDCs) and emission scenario pathways for major emitting countries.
", "votes": 4, "replies": [] }, { "id": 1069798, "author_name": "mattlong2010", "author_url": "", "post_date": "2020-11-05T00:00:11.953000", "content": "1) https://www.kaggle.com/navinmundhra/world-mortality : Dataset contains mortality rates by country, this could be useful in determining how an area of the world deals with other longterm crises:
\n2) https://www.kaggle.com/lin0li/covid19testing and https://www.kaggle.com/paultimothymooney/coronavirus-covid19-mortality-rate-by-country: Datasets contain covid testing and covid mortality by country, this could be useful to determine how an area of the world deals with a sudden onset of a life-altering event
https://www.kaggle.com/aduaanuoluwapo/multidimensional-poverty-index
\nThis dataset is similar to CDP's Social Vulnerability Index(US COUNTY) except that the Multidimensional Poverty Index(MPI) include major cities in many countries of the world and takes into account factors such as poor health, malnutrition, lack of clean water, unemployment, illiteracy, income as well as income to arrive at the index.
\nThe MPI provides an index after taking into account social vulnerability and environmental indicators.
GHG Emissions by Country and Economic Sector
\nThis dataset contains internationally comparable emissions data on GHG from multiple data source (CAIT, PIK, UNFCCC, GCP) from 1850 to 2018. Additionally, it further shows GHG emissions for six individual economic sectors and subsectors on a global scale. The GHGs include carbon dioxide (CO₂), methane (CH₄), hydrofluorocarbons (HFCs), perfluorocarbons (PFCs), sulfur hexafluoride (SF₆), and nitrous oxide (N₂O). The economic sectors include agriculture, bunker fuels, energy, industrial processes, land-use change/forestry, and waste.
This database contains social indicators provided by the United Nations Statistics Division. The indicators are on population, health, education, housing and work.
\nWater Poverty Index
\nfrom the International Hydrological Programme
\nMultidimensional Poverty Index
\nFrom the United Nations
\nAqueduct
\nWater Risk Atlas from the World Ressource Institue
What a Waste is a global project to aggregate data on solid waste management from around the world. This database features the statistics collected through the effort, covering nearly all countries and over 330 cities. The metrics included cover all steps from the waste management value chain, including waste generation, composition, collection, and disposal, as well as information on user fees and financing, the informal sector, administrative structures, public communication, and legal information. The information presented is the best available based on a study of current literature and limited conversations with waste agencies and authorities. While there may be variations in the definitions and quality of reporting for individual data points, general trends should reflect the global reality. All sources and any estimations are noted.
", "votes": 1, "replies": [] }, { "id": 1063807, "author_name": "Roberto Lofaro", "author_url": "", "post_date": "2020-10-29T11:11:56.397000", "content": "I apologize for this long post, but, as my \"dataset\" is actually a \"reasoned subset of WorldBank indicators\" (related to UN SDGs and associated inclusion/social change, as well as other economic and social development indicators), I think that it might be useful to others to see what is within the \"menu\"
\nPS if you want to see the dataset on Kaggle without reading the explanation here… dataset on my Kaggle profile - there you can preview also a sample notebook extracting from the Worldwide dataset a presentation on EU27
\nPPS as I do not know yet if I will have time to prepare a submission notebook, at the bottom of the explanation below I shared some ideas about how the KPIs within the dataset might be used to define KPIs for a submission
\nContent
\nAs part of a long-term publishing project (started in 2015 at Expo2015 in Milan), routinely share data that I collect along my writing journey.
\nOn SDG (focus:EU27) I posted a dataset containing indicators from Eurostat, but then on 2020-04-24 (lockdown), decided to expand the dataset by searching within the Worldbank huge collection of indicators those that could be useful in my interim publications focusing on the same themes
\nHence, selected 33 indicators, and created a dataset containing those indicators, adding a sample notebook focused on EU27 to show the content
\nSelection rationale
\nThe criteria for selection of those 33 indicator was:
\nRelease date and timeframe coverage
\nThe collated dataset was released on 2020-04-24, and contains data from 1999 until 2019 (most indicators end in 2018)
\nData transformations done
\nThe processing of the data, as described within the metadata of the dataset, was the following:
\nThe data are \"raw\", i.e. beside the points 3. and 4. above, no transformation has been applied the data cleaning and transformation for the purposes of the data project will be done within the project
\n\"Raw\" WorldBank indicators list
\nIn order to enable to check on the metadata if the information might be of interested to you, this is the list of the indicators:
\n| index | \nkey | \ndescription | \n
|---|---|---|
| 0 | \nCM.MKT.LCAP.GD.ZS | \nMarket capitalization of listed domestic companies (% of GDP) | \n
| 1 | \nEG.IMP.CONS.ZS | \nEnergy imports, net (% of energy use) | \n
| 2 | \nEG.USE.ELEC.KH.PC | \nElectric power consumption (kWh per capita) | \n
| 3 | \nEN.URB.LCTY.UR.ZS | \nPopulation in the largest city (% of urban population) | \n
| 4 | \nFP.CPI.TOTL.ZG | \nInflation, consumer prices (annual %) | \n
| 5 | \nFR.INR.LNDP | \nInterest rate spread (lending rate minus deposit rate, %) | \n
| 6 | \nFS.AST.PRVT.GD.ZS | \nDomestic credit to private sector (% of GDP) | \n
| 7 | \nGB.XPD.RSDV.GD.ZS | \nResearch and development expenditure (% of GDP) | \n
| 8 | \nGC.NLD.TOTL.GD.ZS | \nNet lending (+) / net borrowing (-) (% of GDP) | \n
| 9 | \nGC.TAX.TOTL.GD.ZS | \nTax revenue (% of GDP) | \n
| 10 | \nGC.XPN.TOTL.GD.ZS | \nExpense (% of GDP) | \n
| 11 | \nIC.BUS.DISC.XQ | \nBusiness extent of disclosure index (0=less disclosure to 10=more disclosure) | \n
| 12 | \nIC.CRD.INFO.XQ | \nDepth of credit information index (0=low to 8=high) | \n
| 13 | \nIC.GOV.DURS.ZS | \nTime spent dealing with the requirements of government regulations (% of senior management time) | \n
| 14 | \nIC.LGL.CRED.XQ | \nStrength of legal rights index (0=weak to 12=strong) | \n
| 15 | \nIC.REG.DURS.FE | \nTime required to start a business, female (days) | \n
| 16 | \nIC.REG.DURS.MA | \nTime required to start a business, male (days) | \n
| 17 | \nIC.TAX.TOTL.CP.ZS | \nTotal tax and contribution rate (% of profit) | \n
| 18 | \nIT.CEL.SETS.P2 | \nMobile cellular subscriptions (per 100 people) | \n
| 19 | \nIT.MLT.MAIN.P2 | \nFixed telephone subscriptions (per 100 people) | \n
| 20 | \nIT.NET.BBND.P2 | \nFixed broadband subscriptions (per 100 people) | \n
| 21 | \nLP.LPI.OVRL.XQ | \nLogistics performance index: Overall (1=low to 5=high) | \n
| 22 | \nMS.MIL.XPND.GD.ZS | \nMilitary expenditure (% of GDP) | \n
| 23 | \nNY.GDP.MKTP.KD.ZG | \nGDP growth (annual %) | \n
| 24 | \nSE.PRM.TCAQ.ZS | \nTrained teachers in primary education (% of total teachers) | \n
| 25 | \nSE.XPD.TOTL.GD.ZS | \nGovernment expenditure on education, total (% of GDP) | \n
| 26 | \nSI.POV.GINI | \nGINI index (World Bank estimate) | \n
| 27 | \nSI.POV.URHC | \nUrban poverty headcount ratio at national poverty lines (% of urban population) | \n
| 28 | \nSL.TLF.CACT.FE.ZS | \nLabor force participation rate, female (% of female population ages 15+) (modeled ILO estimate) | \n
| 29 | \nSL.TLF.CACT.MA.ZS | \nLabor force participation rate, male (% of male population ages 15+) (modeled ILO estimate) | \n
| 30 | \nSL.UEM.TOTL.FE.ZS | \nUnemployment, female (% of female labor force) (modeled ILO estimate) | \n
| 31 | \nSL.UEM.TOTL.MA.ZS | \nUnemployment, male (% of male labor force) (modeled ILO estimate) | \n
| 32 | \nSP.URB.TOTL.IN.ZS | \nUrban population (% of total population) | \n
| 33 | \nTX.VAL.TECH.MF.ZS | \nHigh-technology exports (% of manufactured exports) | \n
The \"keycode\" (e.g. TX.VAL.TECH.MF.ZS) can be used on WorldBank search index to both see the metadata, the timeframe available, preview, and select other export options
\n\nPOTENTIAL RESEARCH QUESTIONS COVERED (the list of numbers is the indicator as per the list above, but it is just a sample- compounding and aggregation through a specific analysis model could actually use more or make irrelevant others)
\nHow do you help cities adapt to a rapidly changing climate amidst a global pandemic, but do it in a way that is socially equitable? 3,4,5,6,8,15,16,18,24,25,26,27,28,29,30,31,32
\nWhat are the projects that can be invested in that will help pull cities out of a recession, mitigate climate issues, but not perpetuate racial/social inequities? same as above, but focusing on \"delta\" (i.e. change impact, trend, acceleration/deceleration of change)
\nWhat are the practical and actionable points where city and corporate ambition join, i.e. where do cities have problems that corporations affected by those problems could solve, and vice versa? 1,2,7,11,13,14,21,23,33
\nHow can we measure the intersection between environmental risks and social equity, as a contributor to resiliency? integrate the above with the data from the \"reference\" dataset within the context
", "votes": 1, "replies": [ { "id": 1064591, "author_name": "Roberto Lofaro", "author_url": "", "post_date": "2020-10-30T09:43:00.490000", "content": "incidentally: if you want a comparison of other datasets/KPIs/models on social impacts, a recent (2020-10-27) workshop from the National Academies, released yesterday on YouTube compares e.g. various Social Vulnerability Indicators and could give some ideas on which other elements/KPIs could be added to move from descriptive, to explanatory, to predictive models
\nthe title is about COVID-19 and vulnerability, but the latter is underlying any analysis of the former and its impacts
\nthe presentation page and link to video recording of the 3h workshop is here- free
", "votes": 1, "replies": [] } ] }, { "id": 1060147, "author_name": "Reuben Pereira", "author_url": "", "post_date": "2020-10-25T20:38:45.530000", "content": "Yearly Air Quality Index (AQI) For CDP Cities
\nThis dataset contains yearly averages of PM2.5 µg/m3 measurements for all of the cities disclosing to the CDP from 2000-2019.
\nMeasurements were obtained weather monitoring stations across the globe, the measurements for the city were obtained by identifying the station of closest proximity.
\nThe data was originally obtained from the Historical Air Quality dataset hosted on BigQuery (see dataset for more details) which contained a maintained air quality dataset provided by the EPA (https://www.epa.gov/).
\nPotential research questions - Can we come up with thresholds that indicate improvements in air quality? Should these thresholds be applied globally or regionally?
", "votes": 1, "replies": [] }, { "id": 1059393, "author_name": "Rasyid Ridha", "author_url": "", "post_date": "2020-10-25T03:24:29.330000", "content": "Chronic Respiratory Disease Mortality Rates
\nThis data shows mortality rates due to chronic respiratory disease in the US by County (original source)
\nUse case: navigate further from City CDP survey data on what kind of projects or actions that the cities have made (environmental metrics changes) and how it is linked with mortality rates due to respiratory disease from this data (social metrics changes)
", "votes": 1, "replies": [] }, { "id": 1058176, "author_name": "ya xin", "author_url": "", "post_date": "2020-10-23T12:31:48.930000", "content": "\nThis dataset shows the state and changes over time in the abstractions of freshwater resources in OECD countries
\n40 country and regions
Uploaded the water treatment data as well from the same source
", "votes": 1, "replies": [ { "id": 1058358, "author_name": "Paul Mooney", "author_url": "", "post_date": "2020-10-23T15:52:23.350000", "content": "Great work! Your starter notebooks make it much easier for other Kagglers to quickly get started with the data. That being said, I think your dataset would get more usage and more visibility if you take the time to improve the usability rating for the two underlying datasets: https://www.kaggle.com/yaxin153537/water-supply and https://www.kaggle.com/yaxin153537/water-treatment. This involves adding a dataset description, an attribution section, and similar information.
\nThanks again for contributing these datasets they look like they could be very useful.
", "votes": 1, "replies": [] }, { "id": 1059523, "author_name": "ya xin", "author_url": "", "post_date": "2020-10-25T07:46:49.917000", "content": "Thanks a lot for the tips, Paul. will look into how to add those things.
", "votes": 2, "replies": [] } ] }, { "id": 1058108, "author_name": "ya xin", "author_url": "", "post_date": "2020-10-23T10:56:57.397000", "content": "\nSome European Cities' pollution and drinking water access data from Eurostat
\n124 cities
Great work! Your starter notebooks make it much easier for other Kagglers to quickly get started with the data. That being said, I think your dataset would get more usage and more visibility if you take the time to improve the usability rating for the underlying dataset: https://www.kaggle.com/yaxin153537/eucities. This involves adding a dataset description, an attribution section, and similar information.
\nThanks again for contributing this public dataset!
", "votes": 0, "replies": [] } ] }, { "id": 1051984, "author_name": "Arman", "author_url": "", "post_date": "2020-10-17T06:27:59.640000", "content": "\nDoes a dataset shared on this thread count as an official submission, or is something else required for it to be considered for the competition?
\nSecondly, are BigQuery datasets hosted on Kaggle eligible?
", "votes": 1, "replies": [ { "id": 1052534, "author_name": "Paul Mooney", "author_url": "", "post_date": "2020-10-17T21:22:14.020000", "content": "If you post a public Kaggle dataset in this thread then it will be considered for the prize, there is not a separate submission form.
", "votes": 0, "replies": [] } ] }, { "id": 1048796, "author_name": "Dracarys", "author_url": "", "post_date": "2020-10-13T19:36:33.370000", "content": "@paultimothymooney official competition dataset link is throwing 404.
Thank you for flagging the typo, the issue is now resolved.
", "votes": 1, "replies": [] } ] }, { "id": 1069773, "author_name": "Abhijit K", "author_url": "", "post_date": "2020-11-04T22:50:47.203000", "content": "World City Daily Weather Data (2015-20)\n
\nhttps://www.kaggle.com/abhijitk/ghcn-daily-weather-data-by-city-20152020
\nThis dataset ontains daily weather data and nearest weather station coordinates of 10000+ cities from around the world.
\nI have generated this dataset by combining two publically available datasets on weather data and city coordinates and demographics. In a nutshell, it uses a city's coordinates to identify the nearest weather station and then extracts the historical daily weather data of this station. A dataset on weather patterns is generated by using the following open/public datasets:
\ni)**Global Historical Climatology Network (GHCN) (https://www.ncdc.noaa.gov/ghcn-daily-description):**
\n\"GHCN (Global Historical Climatology Network)-Daily is an integrated database of daily climate summaries from land surface stations across the globe. Like its monthly counterpart (GHCN-Monthly) , GHCN-Daily is comprised of daily climate records from numerous sources that have been integrated and subjected to a common suite of quality assurance reviews.GHCN-Daily contains records from over 100,000 stations in 180 countries and territories. NCEI provides numerous daily variables, including maximum and minimum temperature, total daily precipitation, snowfall, and snow depth; however, about one half of the stations report precipitation only. Both the record length and period of record vary by station and cover intervals ranging from less than a year to more than 175 years.
ii) **World Cities Database (https://simplemaps.com/data/world-cities):** A database of 26000 cities containing city names, geographical co-ordinates, population, density and country names. The database is available under Creative Commons Attribution 4.0 license.
\ni) Climate change is known to induce high global temperatures, changes in precipitation patterns, shortened frost/winter season, extreme weather events, heat waves, droughts etc.
\nii) Local data provides perspective: From NASAs Global Climate Change: \"…the extent of climate change effects on individual regions will vary over time and with the ability of different societal and environmental systems to mitigate or adapt to change.\" Hence, analysing localized weather patterns, population and changes over and around the cities participating in CDP surveys can provide perspective on adaptation and mitigation measures chosen by a city, infrastructure priorities, social equity programs and policies, gender biases, effect on health of the population etc. National level population and weather data may not account for local variations especially in large diverse countries like USA, China, India, Brazil etc. Hence, localized data is prefereable to national level data.
\niii) High Quality Measurable data: Weather and demographic data are primary, unbiased, recorded, historical data reflecting the on-ground situation. Local weather data like temperature, precipitation, snowfall etc. are regularly measured with quality assurances in place. Similarly, demographic data like population and density have been regularly measured for decades.
\niv) Unbiased: Other data types like projections, self reported data, extrapolations suffer from bias/assumptions of the reporter or analyst/estimator. Indices and basket/combination indicators suffer from biases in weightage given to different parameters. We need to be cautious while using projections, indices etc as they can inject existing biases in current analysis. Organizations and administrations can and are known to 'game' such indicators. Hence, it is preferable to use primary, unbiased and measurable data like weather and population demographics to build KPIs
\nThe dataset generated and the code in this notebook has applications beyond the current competition.
\ni) Ease of Access: The dataset makes climate data on thousands of cities instantly accessible through year-wise CSV files. Additionally , a 'key file' which links each city to the nearest weather station makes it easy to retrieve weather data with only the city and country name. It is presented in a human readable format. It can be easily manipulated using Python, R or even Microsoft Excel/ Google Sheets.
\nii) Scope and Usage The dataset covers thousands of cities beyond the CDP competition dataset. Hence, its potential uses extend to individuals and organizations engaged in sustainability, climate change, metereology etc. Although the notebook generates data for only the last 5 years, it can be modified further to obtain data for any other years from the NOAA database.
\niii) Size NOAA GHCN annual files sizes range from 1-2 GB. The extracted dataset files sizes are in the range of 150-200 MB i.e. almost 10-20% of the original files
\nI) Obtain files from NOAA and Simplemaps
\nII) Use the co-ordinates of each City and weather station to find the weather station closest to each city
\nIII) Extract the data for these weather stations and shape it in a human readable format.
\nWeather data on certain cities is missing or inaccurate because of the following reasons:
\ni) Some of the weather stations identified in the notebook are not polled by the NOAA in recent years. Hence, weather data on certain cities is missing.
\nii) In a few cases, the identified weather stations are very far from the respective cities.
\nPS: I will share the notebook with code for generating this data shortly.
", "votes": 2, "replies": [ { "id": 1069783, "author_name": "Abhijit K", "author_url": "", "post_date": "2020-11-04T23:39:04.693000", "content": "Notebook showing dataset generation:
\nhttps://www.kaggle.com/abhijitk/extracting-weather-data-from-city-coordinates
Downloaded from here, a global dataset of carbon footprints at a 250m spatial resolution (see download link for GeoTIFF files on that page), presented in a 2018 paper Carbon footprints of 13 000 cities. The footprints are calculated based on economic activity using a \"top down\" approach, as opposed to direct measurements of emissions or \"bottom up\" inventories.
\nHere are some quotes from the authors stating why they did what they did:
\n\n\nwhile reporting standards are emerging (e.g. Carbon Disclosure Project 2016) for conducting such assessments, individual city inventories are generally neither comparable nor comprehensive … Furthermore, for most cities no carbon footprint estimate exists.
\n
and how:
\n\n\nIn order to examine the spatial distribution of carbon footprints at the household level, we developed a top-down, globally consistent gridded model. The model uses gridded population and income data to disaggregate existing subnational carbon footprint models for the US, China, Europe, the UK, and Japan, and national data for other countries.
\n
These data seem relevant to this competition for several reasons. The authors note \"individual city inventories are generally neither comparable nor comprehensive\", meaning these data may be useful:
\nAt a more technical level:
\nI plan to build out the notebook for this dataset to improve the integration with the competition data. Hope you find it useful and thanks for sharing your data here!
", "votes": 2, "replies": [] }, { "id": 1068919, "author_name": "Jan Bre", "author_url": "", "post_date": "2020-11-03T21:47:31.883000", "content": "Environmetal Justice in Berlin City
\nThis dataset can be used to investigate how Berlin measures 5 different KPIs to investigare environmental and social issues.
\nMost current datasets focus on environmental and social factors on a global scale, while these trends can also be captures on a city level, which may be more comparable then between different regions with different backgrounds.
\nIt may be interesting to also capture trends on a city scale and investigate wether these are also prevalent on a global / national scale or how they differ.
\nI have standardised and transformed the dataset to a numerical representation from German language to be more accessible and easier to handle.
", "votes": 2, "replies": [] }, { "id": 1068890, "author_name": "RNA", "author_url": "", "post_date": "2020-11-03T21:15:05.270000", "content": "
This dataset contains a selection of resources from SEDAC, the SocioEconomic Data & Applications Center. SEDAC is part of NASA's Earth Observing System Data and Information System, and this data was originally hosted by CIESIN at Columbia University, here.
\nThere are 8 individual datasets, separated into subdirectories and which include full dataset explanations. All sources are fully attributed. Since there is a range of unfamiliar datatypes, and because the data itself can be organised messily, I have included a comprehensive starter kernel here: https://www.kaggle.com/bigironsphere/sedac-introduction-how-to-work-with-this-dataset
\nThe datasets are:
\nI have chosen these as they provide insight into environmental and social factors that are known to disproportionally affect lower socioeconomic groups, and are therefore of key value in assessing how to achieve sustainable development on both a global and regional basis that also helps to combat the effects of inequality. I have tried to prioritise data that is more recent. The geospatial data is especially useful for visualisation, and I have also provided functions in the introductory notebook that allow it to be mapped to any coordinates for city and company locations.
\nI hope this dataset is of use to you in the competition!
", "votes": 2, "replies": [] }, { "id": 1068289, "author_name": "Takahiro Kubo", "author_url": "", "post_date": "2020-11-03T08:49:18.027000", "content": "Annual Financial Data For Hybrid Metrics
\nThis dataset enables the invention of KPI that combines financial performance and environmental, social impact.
\n I collected the corporate annual financial statements and attached the key to join the CDP dataset. The gathered financial data follows the report from Shared Value Initiative about Hybrid Metrics.
I'll add a notebook that guides how to use this dataset. It'll be useful for the final goal of this competition.
", "votes": 2, "replies": [] }, { "id": 1067999, "author_name": "Alexander256", "author_url": "", "post_date": "2020-11-03T00:52:46.637000", "content": "Use of safely managed drinking water services
\nThis dataset focuses on the percent of population for a country using safely managed drinking water services. I think this dataset will be useful for addressing the water supply issue as well as social inequalities. I have also included a notebook to show how to get started with the dataset. I hope others find it useful!
", "votes": 2, "replies": [] }, { "id": 1055836, "author_name": "Arman", "author_url": "", "post_date": "2020-10-21T06:45:28.223000", "content": "World Income Inequality Database
\nThe UNU-WIDER World Income Inequality Database (WIID) provides information on income inequality for 189 developed, developing, and transitioning countries (including historical entities) in an organized and user-friendly manner
", "votes": 2, "replies": [ { "id": 1058350, "author_name": "Paul Mooney", "author_url": "", "post_date": "2020-10-23T15:46:21.743000", "content": "Thank you for contributing this public dataset and for making sure that your dataset has a high usability rating. This looks great! A few small changes you could make that I think would make the dataset even better would be if you: (1) update the datatset metadata or overview page to contain the URL that points to the original source; and (2) if it contained an introductory notebook to make it easy to quickly get started with the data (i.e. overview of dataset structure, how to load files, quick preview of dataset contents, etc).
\nThanks again for contributing such a great public dataset!
", "votes": 1, "replies": [] }, { "id": 1059068, "author_name": "Arman", "author_url": "", "post_date": "2020-10-24T15:18:37.967000", "content": "Thank you for the feedback!
", "votes": 1, "replies": [] } ] }, { "id": 1054219, "author_name": "Frédéric Kosmowski", "author_url": "", "post_date": "2020-10-19T19:11:49.333000", "content": "Datasets I found useful so far:
\n1 - Air Pollution (WHO)
\nDataset covers 4498 cities and 108 countries, many of them also present in the CDP datasets. Air quality is measured with annual mean concentrations particulate matter (PM10 or PM2.5) concentrations from 2008 to 2017. Data descriptor notebook here.
2 - COVID-19 Community Mobility Reports (Google)
\nThe pandemic context brings new challenges to cities. This fantastic resource was created by Google with aggregated, anonymized sets of data from users who have turned on the Location History setting on Android. It captures the changes in mobility between baseline values (median value from the 5‑week period Jan 3 – Feb 6, 2020) at weekly intervals data from February to October 2020. Data include changes in mobility related to workplace, residential, transit hubs, parks, retail and grocery. It covers 593 cities in 43 countries. Kernel is here
3 - Income Group and Inequalities (World Bank)
\nThe World Bank classifies the world's economies into four income groups — high, upper-middle, lower-middle, and low. The dataset contain the 2020 classification on 264 countries. Gini index which measures inequalities is also available from 2011 to 2020 for a set of countries. Starter notebook here
4 - Access to Basic Services (UN Habitat)
\nContains three datasets: a) % of population with access to public transports, b) % access to basic services and c) % population living in slums from 1990 to 2018. Covers 1216 cities from 115 countries. Starter notebook
5 - Ease of Doing Business (World Bank)
\nEase of doing business is an index published by the World Bank. It is an aggregate figure of a country scores on 10 topics and Economies are ranked from 1–190. Dataset contains 213 countries and span the different metrics used to construct the index for 2018, 2019 and 2020. Electricity reliability, outage durations, cost are particularly interesting for the CDP challenge (linkages with energy, transport, etc). Starter notebook here
6 - GHG emissions (CDP)
\nDataset from CDP but not included initially. Annual city-wide emissions for 44 cities. Includes GHG emission with information about how cities measured emissions, as well as why emissions rose/fell since prior reporting period
Great work! A few suggestions: (1) it looks like Access to Basic Services (UN Habitat) and Income Group and Inequalities (World Bank) are both private you should make sure to flip the privacy setting to \"public\" as soon as possible; (2) Air Pollution (WHO) and Ease of Doing Business (World Bank) could be improved by adding a \"dataset description\" section and by improving the dataset usability rating; and (3) just noting that I think that the most useful datasets tend to be datasets that have introductory notebooks that make it easy to quickly get started with the data (overview of dataset structure, how to load files, quick preview of dataset contents, etc).
\nThanks again for contributing these public datasets!
", "votes": 1, "replies": [] } ] }, { "id": 1052700, "author_name": "Arman", "author_url": "", "post_date": "2020-10-18T06:51:08.983000", "content": "Linked below is a global air quality dataset by Open AQ. It includes 5490 locations from 47 countries, is updated weekly and may be useful in correlating emissions data with the overall air quality in a city.
\nhttps://www.kaggle.com/open-aq/openaq
", "votes": 2, "replies": [ { "id": 1052705, "author_name": "Arman", "author_url": "", "post_date": "2020-10-18T06:57:20.890000", "content": "Also sharing a notebook containing examples on how to query the historical data.
\nhttps://www.kaggle.com/mhajabri/air-pollution-101
", "votes": 1, "replies": [] } ] }, { "id": 1059664, "author_name": "ya xin", "author_url": "", "post_date": "2020-10-25T10:27:29.257000", "content": "\nDaily cases of covid-19 by 211 countries and territories from European Union Open Data Portal
\nFrom 31Dec2019 to 24Oct2020
\nIt also includes deaths, Cumulative case of 14 days per 1m people and the population of the countries