
I thank CMI and Kaggle for hosting this interesting competition, and other competitors who worked hard to push up LB improving the quality of the event detection methods. I got my first medal 🦾 and I've learnt a lot from it.
\nStudy context: https://www.kaggle.com/competitions/child-mind-institute-detect-sleep-states/overview
\nData: https://www.kaggle.com/competitions/child-mind-institute-detect-sleep-states/data
The main idea of my solution is to use as little pre/postprocessing as possible, and try to detect sleep/wake events in an end to end fashion. This is because I've observed that different postprocessing methods influence the mAP inconsistently on different folds (increase on some and decrease in others), probably due to the inconsistencies in the labels.
\nMy pipeline contains two kinds of models, one to detect the accurate position of events (aka \"Regressor\"), and one to detect the probability density of the event happening inside a day (aka \"DensityNet\").
\nThis is a simple 1D unet which only uses local information and anglez to detect where the event occurs. This is motivated by Faster-RCNN and subsequent bounding box RPN regression methods like YOLO. As we are working with 1D data and the events are well-separated, it is enough to predict two values, (onset, wakeup) per step.
\nA fixed hyperparameter \"width\" is chosen for training. The data loader will shuffle and load the onset and wakeup events of the training series_id(s), and the time series interval between $ [\\text{event} - \\text{width}, \\text{event} + \\text{width}] $. The target to optimize the model against is the following:
\n
Since the data is noisy, I found out that Huber loss works the best, just like the smooth L1 regression loss in Fast-RCNN, so it is less sensitive to outliers.
\nFor inference, the Regressor network will be run on the whole time series, to predict relative (onset, wakeup) values per step, which gives locations of interest. Gaussian kernels with std=12 and centered at the locations of interest will be accumulated together.
\n
There will be two accumulated scores, one for onset and one for wakeup. The peak of the scores gives the possible locations for the onset and wakeup events. I used the simplest peak detection method:
\n\nlocations = np.argwhere((score[1:-1] > score[:-2]) & (score[1:-1] > score[2:])).flatten() + 1\n
An extra NMS postprocessing step so that predicted locations must be at least 6mins from each other.
\nThe Regressor is a simple 1D Unet, with 1-channel input and 2-channels output, with a 1D ResNet backbone. The hidden channels are 2, 2, 4, 8, 16, 32, 32, and 2 ResNet blocks between each pooling operation. I did not include SE modules and used BatchNorm1D instead of InstanceNorm/GroupNorm/LayerNorm to make the network insensitive to global changes.
\nI trained 3 models on the whole training dataset, with width 120, 180, 240 (10, 15, 20 mins resp.). The score of the 3 models are subsequently averaged before obtaining the locations.
\nTo validate the performance of this model, I computed the argmax of the scores of the steps within 120 steps (10 mins) of each event. The CDF (5 fold out of fold) looks as follows:
\n
Around 85% of the argmax predictions lie between 3mins of the actual event. As there may be multiple peaks in the 240 step interval around the event, we expect the min distance to have less error:
\n
Another network (aka \"DensityNet\") is needed to assign scores to each event. This network has to determine which bout of wake and sleep is the most likely (pick the longest one within a day), and honor the 30-min length and interruption rules as stipulated by https://www.kaggle.com/competitions/child-mind-institute-detect-sleep-states/data. Therefore a longer context is necessary.
\nTo this end, I added transformer encoder modules in the deepest feature level of the 1D Unet to model global information. Since there are at most one event per day, the DensityNet will predict the probability density of the onset/wakeup event in the window of time. I used symmetric ALiBi encodings to make the transformer encoder blocks translation equivariant.
\nI found it useful to train the model on a larger interval than that for inference to include more global context. However, my model does not predict onset/wakeup probabilities per step. Motivated by signal processing, the unknown onset/wakeup signal is a random variable within a fixed interval of interest. As such, the DensityNet is fitted against the ground truth onset+wakeup locations in a 2-day interval.
\nThis is simply the cross entropy loss with 12 * 60 * 24 * 2 = 34560 classes. Since the labels are noisy (and are clipped to nearest min), the target probability distribution is smoothed with the Laplace distribution. Pseudocode:
\n\n = get_distribution(interval_min, interval_min + , series_onset_lbls, series_wakeup_lbls)\n = model(time_series) \n = cross_entropy_loss(pred_logits.permute(, , ), target_distribution) \nSince the data is imputed with fake intervals when the watch is taken off, the DensityNet also predicts two probabilities - whether there is any onset/wakeup event respectively in the whole interval.
\nThe model now does inference only on the center 1-day subinterval of the 2-day interval. To assign scores to the events predicted by the Regressor, we use the conditional probability
\n$$p(t|\\text{actual event in Regressor events}) = \\frac{p(t)}{\\sum_{t' \\in \\text{Regressor events}} p(t')}$$
\nwhere p(t) is the probability density predicted by the DensityNet. To account for the fake intervals, the final scores are
\n$$\\text{score} = q * p(t|\\text{actual event in Regressor events})$$
\nwhere q is the predicted probability that the interval contains some event (onset, wakeup respectively).
\nThe scores for the events in entire series are computed by shifting the prediction window over the whole series and averaged when each prediction window overlaps.
\nThe conditional probability can easily be computed by restricting the softmax to only on the logits of the suggested locations by the Regressor.
\nSimilar to other teams, I shifted the events to xx:xx:15, xx:xx:45 to increase the mAP. Note that xx:xx:30 is undesirable too as there is a 7.5 min window in the mAP score.
\nI am surprised not much top solutions used this trick to increase the mAP. It stands to reason that events cannot be accurately labelled to 3mins / 1min precision, a slight move of the mouse will perturb the label by 1min. Below are the local 5fold out of fold mAP scores (computed with bad series and portions with missing labels removed):
\n
\n(no augmentation)

\n(with augmentation, ~+0.002 mAP)
Matrix profile can detect exact repetitions. I added that as an extra postprocessing step to remove predictions located in fake data.
\nSome top solutions added a binary feature (1, 0) to indicate whether the step lies inside the fake data, or trained only on the intervals with clean data. This should make the model more performant as compared to my current approach of letting the model predict if the events are present in the window.
\nMany top solutions made use of the pattern (uneven distribution of events per 15min). This suggests including the pattern either as input to the model or as a postprocessing step could improve the performance.
", "messages": [ { "id": "2555883", "postDate": "12/10/2023 09:10:24", "content": "I thank CMI and Kaggle for hosting this interesting competition, and other competitors who worked hard to push up LB improving the quality of the event detection methods. I got my first medal 🦾 and I've learnt a lot from it.
\nStudy context: https://www.kaggle.com/competitions/child-mind-institute-detect-sleep-states/overview
\nData: https://www.kaggle.com/competitions/child-mind-institute-detect-sleep-states/data
The main idea of my solution is to use as little pre/postprocessing as possible, and try to detect sleep/wake events in an end to end fashion. This is because I've observed that different postprocessing methods influence the mAP inconsistently on different folds (increase on some and decrease in others), probably due to the inconsistencies in the labels.
\nMy pipeline contains two kinds of models, one to detect the accurate position of events (aka \"Regressor\"), and one to detect the probability density of the event happening inside a day (aka \"DensityNet\").
\nThis is a simple 1D unet which only uses local information and anglez to detect where the event occurs. This is motivated by Faster-RCNN and subsequent bounding box RPN regression methods like YOLO. As we are working with 1D data and the events are well-separated, it is enough to predict two values, (onset, wakeup) per step.
\nA fixed hyperparameter \"width\" is chosen for training. The data loader will shuffle and load the onset and wakeup events of the training series_id(s), and the time series interval between $ [\\text{event} - \\text{width}, \\text{event} + \\text{width}] $. The target to optimize the model against is the following:
\n
Since the data is noisy, I found out that Huber loss works the best, just like the smooth L1 regression loss in Fast-RCNN, so it is less sensitive to outliers.
\nFor inference, the Regressor network will be run on the whole time series, to predict relative (onset, wakeup) values per step, which gives locations of interest. Gaussian kernels with std=12 and centered at the locations of interest will be accumulated together.
\n
There will be two accumulated scores, one for onset and one for wakeup. The peak of the scores gives the possible locations for the onset and wakeup events. I used the simplest peak detection method:
\n\nlocations = np.argwhere((score[1:-1] > score[:-2]) & (score[1:-1] > score[2:])).flatten() + 1\n
An extra NMS postprocessing step so that predicted locations must be at least 6mins from each other.
\nThe Regressor is a simple 1D Unet, with 1-channel input and 2-channels output, with a 1D ResNet backbone. The hidden channels are 2, 2, 4, 8, 16, 32, 32, and 2 ResNet blocks between each pooling operation. I did not include SE modules and used BatchNorm1D instead of InstanceNorm/GroupNorm/LayerNorm to make the network insensitive to global changes.
\nI trained 3 models on the whole training dataset, with width 120, 180, 240 (10, 15, 20 mins resp.). The score of the 3 models are subsequently averaged before obtaining the locations.
\nTo validate the performance of this model, I computed the argmax of the scores of the steps within 120 steps (10 mins) of each event. The CDF (5 fold out of fold) looks as follows:
\n
Around 85% of the argmax predictions lie between 3mins of the actual event. As there may be multiple peaks in the 240 step interval around the event, we expect the min distance to have less error:
\n
Another network (aka \"DensityNet\") is needed to assign scores to each event. This network has to determine which bout of wake and sleep is the most likely (pick the longest one within a day), and honor the 30-min length and interruption rules as stipulated by https://www.kaggle.com/competitions/child-mind-institute-detect-sleep-states/data. Therefore a longer context is necessary.
\nTo this end, I added transformer encoder modules in the deepest feature level of the 1D Unet to model global information. Since there are at most one event per day, the DensityNet will predict the probability density of the onset/wakeup event in the window of time. I used symmetric ALiBi encodings to make the transformer encoder blocks translation equivariant.
\nI found it useful to train the model on a larger interval than that for inference to include more global context. However, my model does not predict onset/wakeup probabilities per step. Motivated by signal processing, the unknown onset/wakeup signal is a random variable within a fixed interval of interest. As such, the DensityNet is fitted against the ground truth onset+wakeup locations in a 2-day interval.
\nThis is simply the cross entropy loss with 12 * 60 * 24 * 2 = 34560 classes. Since the labels are noisy (and are clipped to nearest min), the target probability distribution is smoothed with the Laplace distribution. Pseudocode:
\n\n = get_distribution(interval_min, interval_min + , series_onset_lbls, series_wakeup_lbls)\n = model(time_series) \n = cross_entropy_loss(pred_logits.permute(, , ), target_distribution) \nSince the data is imputed with fake intervals when the watch is taken off, the DensityNet also predicts two probabilities - whether there is any onset/wakeup event respectively in the whole interval.
\nThe model now does inference only on the center 1-day subinterval of the 2-day interval. To assign scores to the events predicted by the Regressor, we use the conditional probability
\n$$p(t|\\text{actual event in Regressor events}) = \\frac{p(t)}{\\sum_{t' \\in \\text{Regressor events}} p(t')}$$
\nwhere p(t) is the probability density predicted by the DensityNet. To account for the fake intervals, the final scores are
\n$$\\text{score} = q * p(t|\\text{actual event in Regressor events})$$
\nwhere q is the predicted probability that the interval contains some event (onset, wakeup respectively).
\nThe scores for the events in entire series are computed by shifting the prediction window over the whole series and averaged when each prediction window overlaps.
\nThe conditional probability can easily be computed by restricting the softmax to only on the logits of the suggested locations by the Regressor.
\nSimilar to other teams, I shifted the events to xx:xx:15, xx:xx:45 to increase the mAP. Note that xx:xx:30 is undesirable too as there is a 7.5 min window in the mAP score.
\nI am surprised not much top solutions used this trick to increase the mAP. It stands to reason that events cannot be accurately labelled to 3mins / 1min precision, a slight move of the mouse will perturb the label by 1min. Below are the local 5fold out of fold mAP scores (computed with bad series and portions with missing labels removed):
\n
\n(no augmentation)
\n(with augmentation, ~+0.002 mAP)
Matrix profile can detect exact repetitions. I added that as an extra postprocessing step to remove predictions located in fake data.
\nSome top solutions added a binary feature (1, 0) to indicate whether the step lies inside the fake data, or trained only on the intervals with clean data. This should make the model more performant as compared to my current approach of letting the model predict if the events are present in the window.
\nMany top solutions made use of the pattern (uneven distribution of events per 15min). This suggests including the pattern either as input to the model or as a postprocessing step could improve the performance.
", "rawMarkdown": "# 8th Place Solution for the Child Mind Institute - Detect Sleep States Competition\nI thank CMI and Kaggle for hosting this interesting competition, and other competitors who worked hard to push up LB improving the quality of the event detection methods. I got my first medal 🦾 and I've learnt a lot from it.\n\n## Context\nStudy context: [https://www.kaggle.com/competitions/child-mind-institute-detect-sleep-states/overview](https://www.kaggle.com/competitions/child-mind-institute-detect-sleep-states/overview)\nData: [https://www.kaggle.com/competitions/child-mind-institute-detect-sleep-states/data](https://www.kaggle.com/competitions/child-mind-institute-detect-sleep-states/data)\n\n# Overview of the approach\n\nThe main idea of my solution is to use as little pre/postprocessing as possible, and try to detect sleep/wake events in an end to end fashion. This is because I've observed that different postprocessing methods influence the mAP inconsistently on different folds (increase on some and decrease in others), probably due to the inconsistencies in the labels.\n\nMy pipeline contains two kinds of models, one to detect the accurate position of events (aka \"Regressor\"), and one to detect the probability density of the event happening inside a day (aka \"DensityNet\").\n\n\n# Details\n## Regressor\nThis is a simple 1D [unet](https://arxiv.org/pdf/1505.04597.pdf) which **only** uses *local information* and *anglez* to detect where the event occurs. This is motivated by [Faster-RCNN](https://arxiv.org/pdf/1506.01497.pdf) and subsequent bounding box RPN regression methods like [YOLO](https://arxiv.org/pdf/1506.02640.pdf). As we are working with 1D data and the events are well-separated, it is enough to predict two values, (onset, wakeup) per step.\n\n### Training\nA fixed hyperparameter \"width\" is chosen for training. The data loader will shuffle and load the onset and wakeup events of the training series_id(s), and the time series interval between $ [\\text{event} - \\text{width}, \\text{event} + \\text{width}] $. The target to optimize the model against is the following:\n\n\n\n- Each box corresponds to a time step (5s)\n- Coloured box is the ground truth location of the event\n- i.e model predicts the relative position of the current step vs location of the event\n\nSince the data is noisy, I found out that Huber loss works the best, just like the smooth L1 regression loss in [Fast-RCNN](https://arxiv.org/pdf/1504.08083.pdf), so it is less sensitive to outliers.\n\n### Inference\nFor inference, the Regressor network will be run on the whole time series, to predict relative (onset, wakeup) values per step, which gives locations of interest. Gaussian kernels with std=12 and centered at the locations of interest will be accumulated together. \n\n\n\n - First row: Relative location predictions by model\n - Second row: Time step\n - Blue color: Current iteration of accumulation\n - Green color: Location of interest at current iteration\n - Graph: Accumulated score \n\nThere will be two accumulated scores, one for onset and one for wakeup. The peak of the scores gives the possible locations for the onset and wakeup events. I used the simplest peak detection method:\n`\nlocations = np.argwhere((score[1:-1] > score[:-2]) & (score[1:-1] > score[2:])).flatten() + 1\n`\n\nAn extra NMS postprocessing step so that predicted locations must be at least 6mins from each other.\n\n### Model architecture\nThe Regressor is a simple 1D Unet, with 1-channel input and 2-channels output, with a [1D ResNet](https://arxiv.org/pdf/1512.03385.pdf) backbone. The hidden channels are 2, 2, 4, 8, 16, 32, 32, and 2 ResNet blocks between each pooling operation. I did not include [SE](https://arxiv.org/pdf/1709.01507.pdf) modules and used BatchNorm1D instead of InstanceNorm/GroupNorm/LayerNorm to make the network insensitive to global changes.\n\n### Ensembling\nI trained 3 models on the whole training dataset, with width 120, 180, 240 (10, 15, 20 mins resp.). The score of the 3 models are subsequently averaged before obtaining the locations.\n\n### Local location prediction quality\nTo validate the performance of this model, I computed the argmax of the scores of the steps within 120 steps (10 mins) of each event. The CDF (5 fold out of fold) looks as follows:\n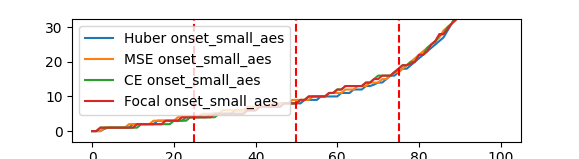\n\n - x-axis percentile\n - y-axis distance in steps\n - model trained with Huber loss performs best\n\nAround 85% of the argmax predictions lie between 3mins of the actual event. As there may be multiple peaks in the 240 step interval around the event, we expect the min distance to have less error:\n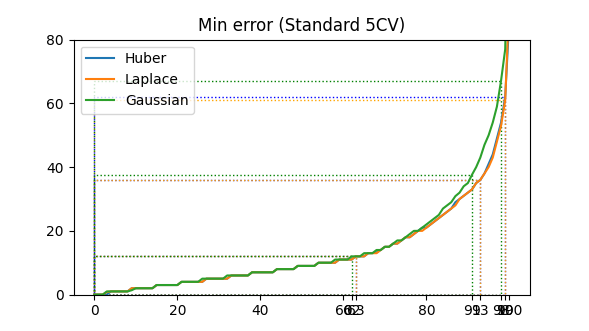\n\n - same x, y-axis\n - min distance between events and all predicted peaks\n - model trained with Huber loss\n - [\"Huber\", \"Gaussian\" , \"Laplace\"] is the shape of the kernel to reconstruct the score\n\n## DensityNet\nAnother network (aka \"DensityNet\") is needed to assign scores to each event. This network has to determine which bout of wake and sleep is the most likely (pick the longest one within a day), and honor the 30-min length and interruption rules as stipulated by [https://www.kaggle.com/competitions/child-mind-institute-detect-sleep-states/data](url). Therefore a longer context is necessary. \n\nTo this end, I added transformer encoder modules in the deepest feature level of the 1D Unet to model global information. Since there are at most one event per day, the DensityNet will predict the probability density of the onset/wakeup event in the window of time. I used symmetric [ALiBi](https://arxiv.org/pdf/2108.12409.pdf) encodings to make the transformer encoder blocks translation equivariant.\n\n### Training\nI found it useful to train the model on a larger interval than that for inference to include more global context. However, my model does not predict onset/wakeup probabilities per step. Motivated by signal processing, the unknown onset/wakeup signal is a random variable within a fixed interval of interest. As such, the DensityNet is fitted against the ground truth onset+wakeup locations in a 2-day interval. \n\nThis is simply the cross entropy loss with 12 * 60 * 24 * 2 = 34560 classes. Since the labels are noisy (and are clipped to nearest min), the target probability distribution is smoothed with the Laplace distribution. Pseudocode:\n\n```\n# (N, T, 2), N = batch_size, T = 34560\ntarget_distribution = get_distribution(interval_min, interval_min + 34560, series_onset_lbls, series_wakeup_lbls)\npred_logits = model(time_series) # (N, T, 2)\nloss = cross_entropy_loss(pred_logits.permute(0, 2, 1), target_distribution) # torch cross entropy acts on 2nd axis\n```\n\nSince the data is imputed with fake intervals when the watch is taken off, the DensityNet also predicts two probabilities - whether there is any onset/wakeup event respectively in the whole interval.\n\n - Trained 3 kinds of models\n - With anglez input only\n - With enmo input only\n - With anglez + time input (time randomly shifted with uniform distribution [-30min, 30min] to avoid overfitting)\n - Random flipping\n - Random elastic deformation\n\n### Inference\nThe model now does inference only on the center 1-day subinterval of the 2-day interval. To assign scores to the events predicted by the Regressor, we use the conditional probability\n\n$$p(t|\\text{actual event in Regressor events}) = \\frac{p(t)}{\\sum_{t' \\in \\text{Regressor events}} p(t')}$$\n\nwhere p(t) is the probability density predicted by the DensityNet. To account for the fake intervals, the final scores are\n\n$$\\text{score} = q * p(t|\\text{actual event in Regressor events})$$\n\nwhere q is the predicted probability that the interval contains some event (onset, wakeup respectively).\n\nThe scores for the events in entire series are computed by shifting the prediction window over the whole series and averaged when each prediction window overlaps.\n\nThe conditional probability can easily be computed by restricting the softmax to only on the logits of the suggested locations by the Regressor.\n\n## Postprocessing\n### Shifting predictions\nSimilar to other teams, I shifted the events to xx:xx:15, xx:xx:45 to increase the mAP. Note that xx:xx:30 is undesirable too as there is a 7.5 min window in the mAP score.\n\n### Augmentations\nI am surprised not much top solutions used this trick to increase the mAP. It stands to reason that events cannot be accurately labelled to 3mins / 1min precision, a slight move of the mouse will perturb the label by 1min. Below are the local 5fold out of fold mAP scores (computed with bad series and portions with missing labels removed):\n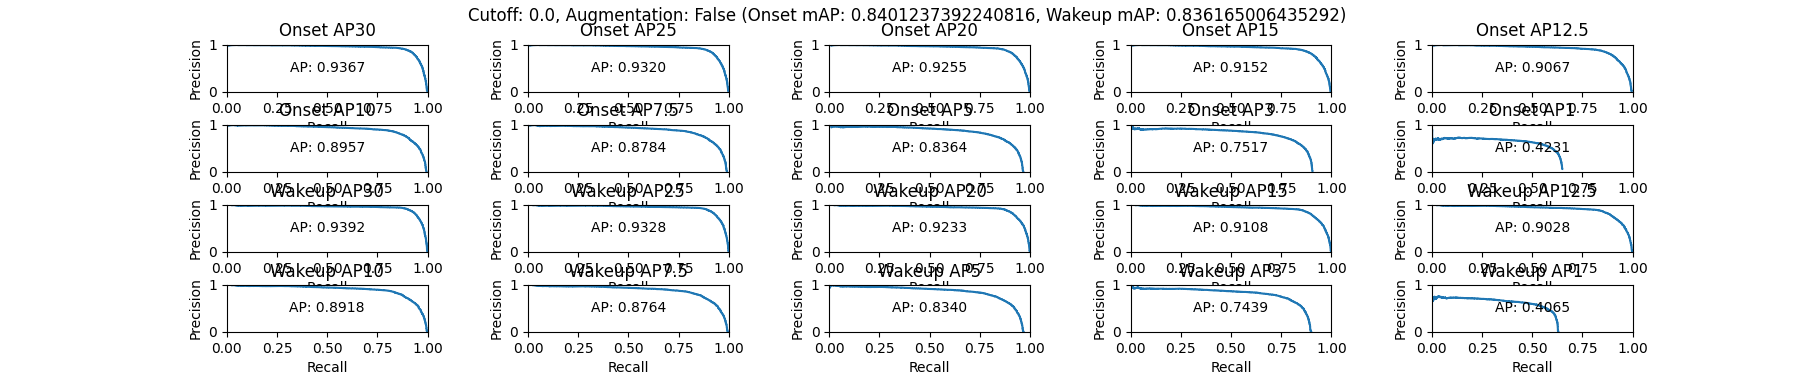\n(no augmentation)\n\n\n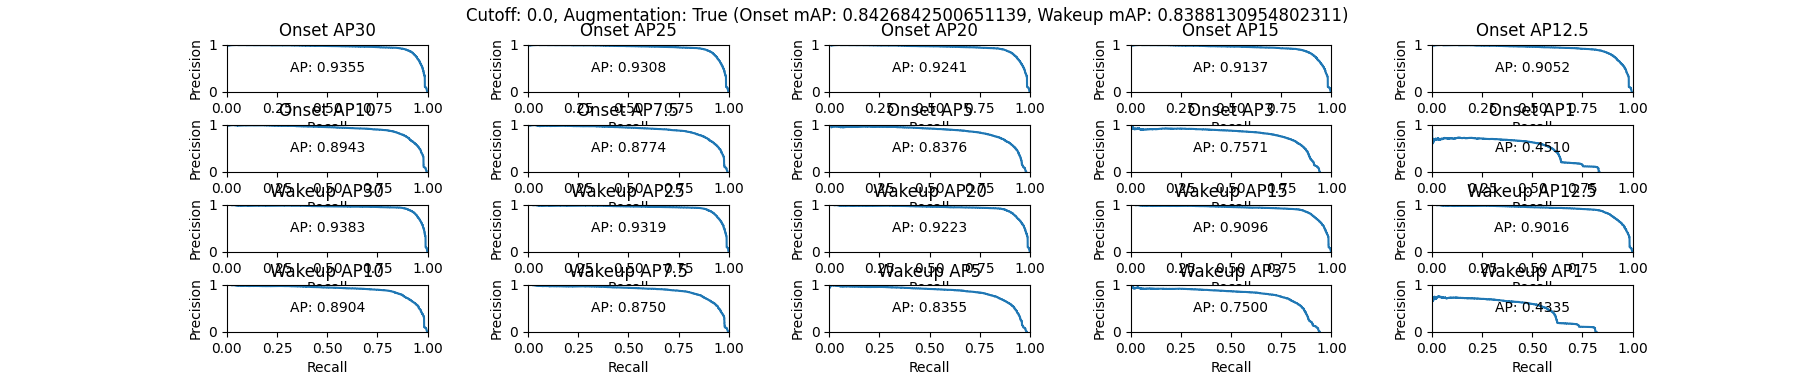\n(with augmentation, ~+0.002 mAP)\n\n - Similar performance for tolerance >3 min\n - Gains for tolerance 1, 3 mins\n\n### Use matrix profile to remove fake data\nMatrix profile can detect exact repetitions. I added that as an extra postprocessing step to remove predictions located in fake data.\n\n# Possible things to improve\n## Use result from matrix profile as input\nSome top solutions added a binary feature (1, 0) to indicate whether the step lies inside the fake data, or trained only on the intervals with clean data. This should make the model more performant as compared to my current approach of letting the model predict if the events are present in the window.\n\n## Make use of per-15 min labelling error distribution\nMany top solutions made use of the pattern (uneven distribution of events per 15min). This suggests including the pattern either as input to the model or as a postprocessing step could improve the performance.", "votes": null }, { "id": "2556199", "postDate": "12/10/2023 14:28:00", "content": "Very interesting inference approach :) Congrats to solo gold!
", "rawMarkdown": "Very interesting inference approach :) Congrats to solo gold!", "votes": null }, { "id": "2556812", "postDate": "12/11/2023 02:14:43", "content": "Congrats on solo gold too! I hope this will be a great start for us on Kaggle.
", "rawMarkdown": "Congrats on solo gold too! I hope this will be a great start for us on Kaggle.", "votes": null }, { "id": "2558956", "postDate": "12/12/2023 13:31:59", "content": "This is a very novel idea.
", "rawMarkdown": "This is a very novel idea.", "votes": null }, { "id": "2561325", "postDate": "12/14/2023 12:16:49", "content": "Very nice implementation and writeup!
\nAlso, the augmentation you used is a great idea - I wish we would have thought to do that too :) We tried some other augmentations that didn't work very well, but you had a clever way to get some more performance.
", "rawMarkdown": "Very nice implementation and writeup! \n\nAlso, the augmentation you used is a great idea - I wish we would have thought to do that too :) We tried some other augmentations that didn't work very well, but you had a clever way to get some more performance.", "votes": null }, { "id": "2561477", "postDate": "12/14/2023 14:12:56", "content": "Thanks Chris, great job on 9th place too! I got that idea by visualizing the precision-recall curves per tolerance. I guess it sometimes helps to break the metric down into its parts to look for potential improvements 🤔.
", "rawMarkdown": "Thanks Chris, great job on 9th place too! I got that idea by visualizing the precision-recall curves per tolerance. I guess it sometimes helps to break the metric down into its parts to look for potential improvements 🤔.", "votes": null } ], "comments": [ { "id": 2556199, "author_name": "fritzcremer", "author_url": "", "post_date": "12/10/2023 14:28:00", "content": "Very interesting inference approach :) Congrats to solo gold!
", "votes": null, "replies": [ { "id": 2556812, "author_name": "chauyh", "author_url": "", "post_date": "12/11/2023 02:14:43", "content": "Congrats on solo gold too! I hope this will be a great start for us on Kaggle.
", "votes": null, "replies": [] } ] }, { "id": 2558956, "author_name": "dongyk", "author_url": "", "post_date": "12/12/2023 13:31:59", "content": "This is a very novel idea.
", "votes": null, "replies": [] }, { "id": 2561325, "author_name": "chris62", "author_url": "", "post_date": "12/14/2023 12:16:49", "content": "Very nice implementation and writeup!
\nAlso, the augmentation you used is a great idea - I wish we would have thought to do that too :) We tried some other augmentations that didn't work very well, but you had a clever way to get some more performance.
", "votes": null, "replies": [ { "id": 2561477, "author_name": "chauyh", "author_url": "", "post_date": "12/14/2023 14:12:56", "content": "Thanks Chris, great job on 9th place too! I got that idea by visualizing the precision-recall curves per tolerance. I guess it sometimes helps to break the metric down into its parts to look for potential improvements 🤔.
", "votes": null, "replies": [] } ] } ], "raw_markdown_by_id": { "2555883": "# 8th Place Solution for the Child Mind Institute - Detect Sleep States Competition\nI thank CMI and Kaggle for hosting this interesting competition, and other competitors who worked hard to push up LB improving the quality of the event detection methods. I got my first medal 🦾 and I've learnt a lot from it.\n\n## Context\nStudy context: [https://www.kaggle.com/competitions/child-mind-institute-detect-sleep-states/overview](https://www.kaggle.com/competitions/child-mind-institute-detect-sleep-states/overview)\nData: [https://www.kaggle.com/competitions/child-mind-institute-detect-sleep-states/data](https://www.kaggle.com/competitions/child-mind-institute-detect-sleep-states/data)\n\n# Overview of the approach\n\nThe main idea of my solution is to use as little pre/postprocessing as possible, and try to detect sleep/wake events in an end to end fashion. This is because I've observed that different postprocessing methods influence the mAP inconsistently on different folds (increase on some and decrease in others), probably due to the inconsistencies in the labels.\n\nMy pipeline contains two kinds of models, one to detect the accurate position of events (aka \"Regressor\"), and one to detect the probability density of the event happening inside a day (aka \"DensityNet\").\n\n\n# Details\n## Regressor\nThis is a simple 1D [unet](https://arxiv.org/pdf/1505.04597.pdf) which **only** uses *local information* and *anglez* to detect where the event occurs. This is motivated by [Faster-RCNN](https://arxiv.org/pdf/1506.01497.pdf) and subsequent bounding box RPN regression methods like [YOLO](https://arxiv.org/pdf/1506.02640.pdf). As we are working with 1D data and the events are well-separated, it is enough to predict two values, (onset, wakeup) per step.\n\n### Training\nA fixed hyperparameter \"width\" is chosen for training. The data loader will shuffle and load the onset and wakeup events of the training series_id(s), and the time series interval between $ [\\text{event} - \\text{width}, \\text{event} + \\text{width}] $. The target to optimize the model against is the following:\n\n\n\n- Each box corresponds to a time step (5s)\n- Coloured box is the ground truth location of the event\n- i.e model predicts the relative position of the current step vs location of the event\n\nSince the data is noisy, I found out that Huber loss works the best, just like the smooth L1 regression loss in [Fast-RCNN](https://arxiv.org/pdf/1504.08083.pdf), so it is less sensitive to outliers.\n\n### Inference\nFor inference, the Regressor network will be run on the whole time series, to predict relative (onset, wakeup) values per step, which gives locations of interest. Gaussian kernels with std=12 and centered at the locations of interest will be accumulated together. \n\n\n\n - First row: Relative location predictions by model\n - Second row: Time step\n - Blue color: Current iteration of accumulation\n - Green color: Location of interest at current iteration\n - Graph: Accumulated score \n\nThere will be two accumulated scores, one for onset and one for wakeup. The peak of the scores gives the possible locations for the onset and wakeup events. I used the simplest peak detection method:\n`\nlocations = np.argwhere((score[1:-1] > score[:-2]) & (score[1:-1] > score[2:])).flatten() + 1\n`\n\nAn extra NMS postprocessing step so that predicted locations must be at least 6mins from each other.\n\n### Model architecture\nThe Regressor is a simple 1D Unet, with 1-channel input and 2-channels output, with a [1D ResNet](https://arxiv.org/pdf/1512.03385.pdf) backbone. The hidden channels are 2, 2, 4, 8, 16, 32, 32, and 2 ResNet blocks between each pooling operation. I did not include [SE](https://arxiv.org/pdf/1709.01507.pdf) modules and used BatchNorm1D instead of InstanceNorm/GroupNorm/LayerNorm to make the network insensitive to global changes.\n\n### Ensembling\nI trained 3 models on the whole training dataset, with width 120, 180, 240 (10, 15, 20 mins resp.). The score of the 3 models are subsequently averaged before obtaining the locations.\n\n### Local location prediction quality\nTo validate the performance of this model, I computed the argmax of the scores of the steps within 120 steps (10 mins) of each event. The CDF (5 fold out of fold) looks as follows:\n\n\n - x-axis percentile\n - y-axis distance in steps\n - model trained with Huber loss performs best\n\nAround 85% of the argmax predictions lie between 3mins of the actual event. As there may be multiple peaks in the 240 step interval around the event, we expect the min distance to have less error:\n\n\n - same x, y-axis\n - min distance between events and all predicted peaks\n - model trained with Huber loss\n - [\"Huber\", \"Gaussian\" , \"Laplace\"] is the shape of the kernel to reconstruct the score\n\n## DensityNet\nAnother network (aka \"DensityNet\") is needed to assign scores to each event. This network has to determine which bout of wake and sleep is the most likely (pick the longest one within a day), and honor the 30-min length and interruption rules as stipulated by [https://www.kaggle.com/competitions/child-mind-institute-detect-sleep-states/data](url). Therefore a longer context is necessary. \n\nTo this end, I added transformer encoder modules in the deepest feature level of the 1D Unet to model global information. Since there are at most one event per day, the DensityNet will predict the probability density of the onset/wakeup event in the window of time. I used symmetric [ALiBi](https://arxiv.org/pdf/2108.12409.pdf) encodings to make the transformer encoder blocks translation equivariant.\n\n### Training\nI found it useful to train the model on a larger interval than that for inference to include more global context. However, my model does not predict onset/wakeup probabilities per step. Motivated by signal processing, the unknown onset/wakeup signal is a random variable within a fixed interval of interest. As such, the DensityNet is fitted against the ground truth onset+wakeup locations in a 2-day interval. \n\nThis is simply the cross entropy loss with 12 * 60 * 24 * 2 = 34560 classes. Since the labels are noisy (and are clipped to nearest min), the target probability distribution is smoothed with the Laplace distribution. Pseudocode:\n\n```\n# (N, T, 2), N = batch_size, T = 34560\ntarget_distribution = get_distribution(interval_min, interval_min + 34560, series_onset_lbls, series_wakeup_lbls)\npred_logits = model(time_series) # (N, T, 2)\nloss = cross_entropy_loss(pred_logits.permute(0, 2, 1), target_distribution) # torch cross entropy acts on 2nd axis\n```\n\nSince the data is imputed with fake intervals when the watch is taken off, the DensityNet also predicts two probabilities - whether there is any onset/wakeup event respectively in the whole interval.\n\n - Trained 3 kinds of models\n - With anglez input only\n - With enmo input only\n - With anglez + time input (time randomly shifted with uniform distribution [-30min, 30min] to avoid overfitting)\n - Random flipping\n - Random elastic deformation\n\n### Inference\nThe model now does inference only on the center 1-day subinterval of the 2-day interval. To assign scores to the events predicted by the Regressor, we use the conditional probability\n\n$$p(t|\\text{actual event in Regressor events}) = \\frac{p(t)}{\\sum_{t' \\in \\text{Regressor events}} p(t')}$$\n\nwhere p(t) is the probability density predicted by the DensityNet. To account for the fake intervals, the final scores are\n\n$$\\text{score} = q * p(t|\\text{actual event in Regressor events})$$\n\nwhere q is the predicted probability that the interval contains some event (onset, wakeup respectively).\n\nThe scores for the events in entire series are computed by shifting the prediction window over the whole series and averaged when each prediction window overlaps.\n\nThe conditional probability can easily be computed by restricting the softmax to only on the logits of the suggested locations by the Regressor.\n\n## Postprocessing\n### Shifting predictions\nSimilar to other teams, I shifted the events to xx:xx:15, xx:xx:45 to increase the mAP. Note that xx:xx:30 is undesirable too as there is a 7.5 min window in the mAP score.\n\n### Augmentations\nI am surprised not much top solutions used this trick to increase the mAP. It stands to reason that events cannot be accurately labelled to 3mins / 1min precision, a slight move of the mouse will perturb the label by 1min. Below are the local 5fold out of fold mAP scores (computed with bad series and portions with missing labels removed):\n\n(no augmentation)\n\n\n\n(with augmentation, ~+0.002 mAP)\n\n - Similar performance for tolerance >3 min\n - Gains for tolerance 1, 3 mins\n\n### Use matrix profile to remove fake data\nMatrix profile can detect exact repetitions. I added that as an extra postprocessing step to remove predictions located in fake data.\n\n# Possible things to improve\n## Use result from matrix profile as input\nSome top solutions added a binary feature (1, 0) to indicate whether the step lies inside the fake data, or trained only on the intervals with clean data. This should make the model more performant as compared to my current approach of letting the model predict if the events are present in the window.\n\n## Make use of per-15 min labelling error distribution\nMany top solutions made use of the pattern (uneven distribution of events per 15min). This suggests including the pattern either as input to the model or as a postprocessing step could improve the performance.", "2556199": "Very interesting inference approach :) Congrats to solo gold!", "2556812": "Congrats on solo gold too! I hope this will be a great start for us on Kaggle.", "2558956": "This is a very novel idea.", "2561325": "Very nice implementation and writeup! \n\nAlso, the augmentation you used is a great idea - I wish we would have thought to do that too :) We tried some other augmentations that didn't work very well, but you had a clever way to get some more performance.", "2561477": "Thanks Chris, great job on 9th place too! I got that idea by visualizing the precision-recall curves per tolerance. I guess it sometimes helps to break the metric down into its parts to look for potential improvements 🤔." }, "source": "meta" }