
I said I'll describe my solution if it ended up in top 10, so here it is.
\n\nFirst of all, I'd like to thank Kaggle for this challenging series of forecasting competitions. I say challenging for two reasons. First, this is about people being sick and people dying. It is hard to abstract from that dire reality. Second, one week sprints are too short for me. I need more time to immerse in a given machine learning problem. In this case it took me 4 weeks and 2 days to find a model I was happy with.
\n\nI also want to thanks my teams mates for first 3 weeks, Ahmet and Giba. They preferred to go solo last week but I would have been happy to stick as a team. We used very different models (NN for Ahmet, xgb/lgb for Giba, lr for me) with he hope that together it would work well. It did actually in week2 but we didn't select it at the last minute because of some cv issue. It would have landed us at rank 8th unless mistaken. Week 3 was a bit disappointing for us.
\n\nI also warmly thank those who curated the additional datasets I used, especially Vopani. Using these made a difference.
\n\nLast but not least I want to congratulate those who did consistently well in these competitions, and especially those who did well in week 4. @david1013 seems to have great models, even when not using an extra day of data if I get his recent posts correctly. It would be interesting to know Lockdown and Kaz model score when not using an extra day as well. Paulo Pinto performance in week 4 is awesome. I can't name all but let me mentions PDD team who did well in several weeks too.
\n\nI decided early on to not approach this as I usually build forecasting models. Reason is we are modeling a physical phenomenon where people get infected, then infect others for some time, then either recover or die. I therefore studied compartmental models used in epidemiology, SIR and the like. These models rely on two time series: cases and recoveries/deaths. If we have accurate values for both then we can fit these models and get reasonably accurate predictions.
\n\nIssue is we don't have these series.
\n\nFor cases we have a proxy, confirmed cases. This is a proxy in many ways:\n- It depends on the testing policy of each geography. Some test a lot, and confirmed cases are close to all cases.\n- A large fraction of sick people are asymptomatic, hence are easily missed by testing.\n- Testing does not happen when people get infected or contagious, it often happens with a delay.\nFor all these reasons the confirmed case nubers we get is a distorted view of actual cases.
\n\nFor fatalities the numbers aren't accurate either;\n- In some geos we only get deaths test at hospital, in other geos it includes fatalities from nursing homes.\n- We don't have recoveries data.\nThe latter can be fixed by grabbing recovery data from other online source. This has been done by some top competitors, I wish I had done it.
\n\nDespite all these caveat, I assumed that we still have some form of SIR model at play with the two series we have at hand: fatalities depend on cases detected some while ago. That led to my first model.
\n\nIf we assume that fatalities are a proportion of cases from, say, 8 days ago, then the proportion can be computed from log scaled data. See examples below for some countries. Green curve is the difference between confirmed cases (blue) and fatalities 8 days later (orange)
\n\nItaly:
\n\n
France:
\n\n
Spain:\n
Then running a linear regression on log of past cases as input, and log of fatalities as output should capture this dependency. I published a simplified version in a notebook. The above pictures are taken from it.
\n\nThe fact that the proportion depends on the geography can be captured via additional input features. In practice I found that log fatalities increase is a linear regression of cases from between 15 to 5 days ago. These limits were tuned via cross validation. They match what researchers say about Covid.
\n\nWe used time based cross validation for our models. We selected 3 to 5 folds, depending on the week competition. Each fold uses data until a given data for training models, and data after for validation. One fold was defined by the actual test data: validation starts at the first day of test data, even though train and test data overlap.
\n\nModels in our team were trained to predict next day. To predict on a longer period we append the prediction to train data, then apply to model on it shifted by one day to get the prediction for the second day. We repeat for all remaining days in validation or test. Other teams trained one model per prediction day. I didn't thought of it but it is definitely doable given how fast training my model is.
\n\nFor cases I used an auto regressive model, i.e. linear regression using past values as input. That model was not that bad, but it turned out to be pessimistic. The flattening of curves we observed wasn't captured correctly. I spent the last 2 weeks thinking about how to model this. I tried to revisit the epidemiology models, but couldn't find a way to reliably fit them for all geos. I didn't want to add an arbitrary decay, or fit a curve either. I therefore turned back to data exploration. And the day before deadline I found that a log of the decay in daily cases was very interesting, see some plots below.
\n\n
It means that daily cases decrease linearly in the log space. It means that the number of daily cases is of the form N - exp(a t) where N is a starting population, a a constant, and t the number of days. I explain this derivation here.
\n\nThe model is therefore fitting a linear model on the log of cases over time.
\n\nThis model works well in geos where the number of cases is high, but fails miserably in geos where epidemic starts. I therefore blended it with the previous one, with weights depending on the number of cases a while ago, 12 days if I remember well. This model improved CV scores tremendously compared to the previous one. It was modeling curve flattening rather well, at last.
\n\nI then tried the same with fatalities: They indeed decrease linearly in the log space, but the data is sparse: I could fit a linear regression reliably only for geos with a rather large number of cases. Fortunately for people and unfortunately for my model, there were not that many geos like this. Then I realized I could use the same trick as in my very first model: log of fatalities depend linearly on past log cases. I could therefore fit a linear regression on past log cases as input, and log of fatalities as output. I used the same past period, i.e. cases between 15 to 5 days ago more or less (I don't remember the exact figures). My fatalities model is therefore a blend of the original linear model from past cases, a linear regression fit on past log fatalities, and a linear regression fit on past log cases.
\n\nThat's what I submitted.
\n\nI am rather pleased to see that a simple blend of linear models was competitive. I wasn't sure I could handle differences in geos via adaptive weights when blending, but it seems it was good enough.
\n\nAfter one day of rest after deadline I realized I could have done a better job. If fatalities depend on the slope of the log of cases, and if that slope is constant, then why estimate it on days from 15 to 5 days before, and not on days from, say 10 days to current day? Using more recent data is always better, then why not here? I implemented this small change and used late submission. This improved model score was similar to the one I submitted in time until last week where it started to outperform it. Its final private Lb score is 0.41840. Bottom line is it took me 4 weeks and 2 days to get the right model...
\n\nI contemplated entering week 5 but didn't for 3 reasons. One reason is I was bothered by the extra day data from world odometer. I saw people who used it in week 4 ask for it to be forbidden. It would have been a smart move IMHO. Another reason, more important, is that a one week sprint with changes in competition setting was too short for me. Last reason may be even more important. I think my model works better when there are high level of cases and fatalities. The inclusion of smaller grained geos like US counties probably mean that my model would not be a great fit.
\n\nI admire those who entered week 5 and I'm looking forward to their writeups when the competition completes!
", "comments": [ { "id": 1106654, "author_name": "Akash Dey", "author_url": "", "post_date": "2020-12-09T02:34:04.643000", "content": "This felt like reading a story. Falling in love with Kaggle and all these amazing works done by all of you are the reason for it. Thank you for this.
", "votes": 1, "replies": [] }, { "id": 1092325, "author_name": "Deniz Nemli", "author_url": "", "post_date": "2020-11-26T17:41:52.160000", "content": "thanks for sharing! you are showing clearly that even a simple algorithm like linear regression can be very powerful in the right hands :)
", "votes": 1, "replies": [ { "id": 1096999, "author_name": "CPMP", "author_url": "", "post_date": "2020-11-30T23:33:53.460000", "content": "Simple models are often overlooked in Kaggle competitions ;)
", "votes": 0, "replies": [] } ] }, { "id": 856460, "author_name": "Arindam", "author_url": "", "post_date": "2020-05-21T18:09:54.417000", "content": "awesome
", "votes": 1, "replies": [] }, { "id": 853386, "author_name": "TrevorNell", "author_url": "", "post_date": "2020-05-19T06:29:26.817000", "content": "Thanks for the writeup, it is impressive visually and good story telling skills.
", "votes": 1, "replies": [] }, { "id": 849532, "author_name": "Μαριος Μιχαηλιδης KazAnova", "author_url": "", "post_date": "2020-05-15T21:11:08.067000", "content": "Congrats for the strong finish!
", "votes": 1, "replies": [ { "id": 849554, "author_name": "CPMP", "author_url": "", "post_date": "2020-05-15T22:22:22.293000", "content": "Thanks!
", "votes": 2, "replies": [] } ] }, { "id": 849264, "author_name": "Kirderf", "author_url": "", "post_date": "2020-05-15T15:58:04.803000", "content": "Thanks for your writeup and great models through the weeks! Sad that your not with us in W5 comp, but maybe we will have a W6, take the best of all the weeks rules/content. We want more teams to collaborate in the mission, there was a steady increase in teams up to w4. I think it could be an idea to extend next deadline if one can't re-use prev models, but shorter/1w if one can.
", "votes": 1, "replies": [ { "id": 849555, "author_name": "CPMP", "author_url": "", "post_date": "2020-05-15T22:22:53.200000", "content": "One week was too short for me.
", "votes": 1, "replies": [] } ] }, { "id": 853429, "author_name": "Amaan", "author_url": "", "post_date": "2020-05-19T07:20:25.630000", "content": "What a story ! You perfectly described your work. No wonder you rule the Discussions rankings 🥇
", "votes": 2, "replies": [ { "id": 854547, "author_name": "CPMP", "author_url": "", "post_date": "2020-05-20T05:20:13.750000", "content": "Thanks. Note that I no longer rule discussion ranking ;)
", "votes": 2, "replies": [] } ] }, { "id": 849253, "author_name": "Psi", "author_url": "", "post_date": "2020-05-15T15:50:33.743000", "content": "Congrats on a strong finish and thanks for sharing the detailed writeup!
", "votes": 2, "replies": [ { "id": 849433, "author_name": "CPMP", "author_url": "", "post_date": "2020-05-15T18:44:22.883000", "content": "Thanks, and congrats on the consistent performance across weeks.
", "votes": 3, "replies": [] } ] }, { "id": 1697398, "author_name": "sajjad parizan", "author_url": "", "post_date": "2022-02-19T15:48:06.897000", "content": "it definitely shows that with a creative mind we can use a simple model to get a good result
\nall we should do is to look at our problem from different points of view.
\nwell done👍
Thanks for sharing, very comprehensive and detailed.
", "votes": 0, "replies": [] }, { "id": 859793, "author_name": "Marouen Baalouch", "author_url": "", "post_date": "2020-05-24T18:36:25.383000", "content": "Nice job using interpretable modeling, thanks for sharing.
", "votes": 0, "replies": [] }, { "id": 1235299, "author_name": "", "author_url": "", "post_date": "2021-03-12T03:27:28.010000", "content": "", "votes": 0, "replies": [] }, { "id": 854494, "author_name": "Abhay Dhiman", "author_url": "", "post_date": "2020-05-20T04:11:43.067000", "content": "thanks for sharing, great work.
", "votes": 1, "replies": [] }, { "id": 849262, "author_name": "TADA", "author_url": "", "post_date": "2020-05-15T15:54:56.170000", "content": "Thanks, for such details. Nice work.
", "votes": 2, "replies": [] }, { "id": 1388943, "author_name": "Anton Semeniuta", "author_url": "", "post_date": "2021-07-15T10:19:30.430000", "content": "Thank you for sharing!
", "votes": 0, "replies": [] }, { "id": 895393, "author_name": "Tayebi Mohammed", "author_url": "", "post_date": "2020-06-21T10:02:09.940000", "content": "thanks for sharing, great work
", "votes": 0, "replies": [] }, { "id": 856682, "author_name": "Rodrigo Lomonaco", "author_url": "", "post_date": "2020-05-22T01:41:41.847000", "content": "Nice job! Thanks for sharing!
", "votes": 0, "replies": [] } ], "comment_count": 22, "messages": [ { "id": 849227, "postDate": "2020-05-15T15:34:35.823Z", "content": "I said I'll describe my solution if it ended up in top 10, so here it is.
\n\nFirst of all, I'd like to thank Kaggle for this challenging series of forecasting competitions. I say challenging for two reasons. First, this is about people being sick and people dying. It is hard to abstract from that dire reality. Second, one week sprints are too short for me. I need more time to immerse in a given machine learning problem. In this case it took me 4 weeks and 2 days to find a model I was happy with.
\n\nI also want to thanks my teams mates for first 3 weeks, Ahmet and Giba. They preferred to go solo last week but I would have been happy to stick as a team. We used very different models (NN for Ahmet, xgb/lgb for Giba, lr for me) with he hope that together it would work well. It did actually in week2 but we didn't select it at the last minute because of some cv issue. It would have landed us at rank 8th unless mistaken. Week 3 was a bit disappointing for us.
\n\nI also warmly thank those who curated the additional datasets I used, especially Vopani. Using these made a difference.
\n\nLast but not least I want to congratulate those who did consistently well in these competitions, and especially those who did well in week 4. @david1013 seems to have great models, even when not using an extra day of data if I get his recent posts correctly. It would be interesting to know Lockdown and Kaz model score when not using an extra day as well. Paulo Pinto performance in week 4 is awesome. I can't name all but let me mentions PDD team who did well in several weeks too.
\n\nI decided early on to not approach this as I usually build forecasting models. Reason is we are modeling a physical phenomenon where people get infected, then infect others for some time, then either recover or die. I therefore studied compartmental models used in epidemiology, SIR and the like. These models rely on two time series: cases and recoveries/deaths. If we have accurate values for both then we can fit these models and get reasonably accurate predictions.
\n\nIssue is we don't have these series.
\n\nFor cases we have a proxy, confirmed cases. This is a proxy in many ways:\n- It depends on the testing policy of each geography. Some test a lot, and confirmed cases are close to all cases.\n- A large fraction of sick people are asymptomatic, hence are easily missed by testing.\n- Testing does not happen when people get infected or contagious, it often happens with a delay.\nFor all these reasons the confirmed case nubers we get is a distorted view of actual cases.
\n\nFor fatalities the numbers aren't accurate either;\n- In some geos we only get deaths test at hospital, in other geos it includes fatalities from nursing homes.\n- We don't have recoveries data.\nThe latter can be fixed by grabbing recovery data from other online source. This has been done by some top competitors, I wish I had done it.
\n\nDespite all these caveat, I assumed that we still have some form of SIR model at play with the two series we have at hand: fatalities depend on cases detected some while ago. That led to my first model.
\n\nIf we assume that fatalities are a proportion of cases from, say, 8 days ago, then the proportion can be computed from log scaled data. See examples below for some countries. Green curve is the difference between confirmed cases (blue) and fatalities 8 days later (orange)
\n\nItaly:
\n\n
France:
\n\n
Spain:\n
Then running a linear regression on log of past cases as input, and log of fatalities as output should capture this dependency. I published a simplified version in a notebook. The above pictures are taken from it.
\n\nThe fact that the proportion depends on the geography can be captured via additional input features. In practice I found that log fatalities increase is a linear regression of cases from between 15 to 5 days ago. These limits were tuned via cross validation. They match what researchers say about Covid.
\n\nWe used time based cross validation for our models. We selected 3 to 5 folds, depending on the week competition. Each fold uses data until a given data for training models, and data after for validation. One fold was defined by the actual test data: validation starts at the first day of test data, even though train and test data overlap.
\n\nModels in our team were trained to predict next day. To predict on a longer period we append the prediction to train data, then apply to model on it shifted by one day to get the prediction for the second day. We repeat for all remaining days in validation or test. Other teams trained one model per prediction day. I didn't thought of it but it is definitely doable given how fast training my model is.
\n\nFor cases I used an auto regressive model, i.e. linear regression using past values as input. That model was not that bad, but it turned out to be pessimistic. The flattening of curves we observed wasn't captured correctly. I spent the last 2 weeks thinking about how to model this. I tried to revisit the epidemiology models, but couldn't find a way to reliably fit them for all geos. I didn't want to add an arbitrary decay, or fit a curve either. I therefore turned back to data exploration. And the day before deadline I found that a log of the decay in daily cases was very interesting, see some plots below.
\n\n
It means that daily cases decrease linearly in the log space. It means that the number of daily cases is of the form N - exp(a t) where N is a starting population, a a constant, and t the number of days. I explain this derivation here.
\n\nThe model is therefore fitting a linear model on the log of cases over time.
\n\nThis model works well in geos where the number of cases is high, but fails miserably in geos where epidemic starts. I therefore blended it with the previous one, with weights depending on the number of cases a while ago, 12 days if I remember well. This model improved CV scores tremendously compared to the previous one. It was modeling curve flattening rather well, at last.
\n\nI then tried the same with fatalities: They indeed decrease linearly in the log space, but the data is sparse: I could fit a linear regression reliably only for geos with a rather large number of cases. Fortunately for people and unfortunately for my model, there were not that many geos like this. Then I realized I could use the same trick as in my very first model: log of fatalities depend linearly on past log cases. I could therefore fit a linear regression on past log cases as input, and log of fatalities as output. I used the same past period, i.e. cases between 15 to 5 days ago more or less (I don't remember the exact figures). My fatalities model is therefore a blend of the original linear model from past cases, a linear regression fit on past log fatalities, and a linear regression fit on past log cases.
\n\nThat's what I submitted.
\n\nI am rather pleased to see that a simple blend of linear models was competitive. I wasn't sure I could handle differences in geos via adaptive weights when blending, but it seems it was good enough.
\n\nAfter one day of rest after deadline I realized I could have done a better job. If fatalities depend on the slope of the log of cases, and if that slope is constant, then why estimate it on days from 15 to 5 days before, and not on days from, say 10 days to current day? Using more recent data is always better, then why not here? I implemented this small change and used late submission. This improved model score was similar to the one I submitted in time until last week where it started to outperform it. Its final private Lb score is 0.41840. Bottom line is it took me 4 weeks and 2 days to get the right model...
\n\nI contemplated entering week 5 but didn't for 3 reasons. One reason is I was bothered by the extra day data from world odometer. I saw people who used it in week 4 ask for it to be forbidden. It would have been a smart move IMHO. Another reason, more important, is that a one week sprint with changes in competition setting was too short for me. Last reason may be even more important. I think my model works better when there are high level of cases and fatalities. The inclusion of smaller grained geos like US counties probably mean that my model would not be a great fit.
\n\nI admire those who entered week 5 and I'm looking forward to their writeups when the competition completes!
", "rawMarkdown": "I said I'll describe my solution if it ended up in top 10, so here it is. \n\n# Acknowledgements\n\nFirst of all, I'd like to thank Kaggle for this challenging series of forecasting competitions. I say challenging for two reasons. First, this is about people being sick and people dying. It is hard to abstract from that dire reality. Second, one week sprints are too short for me. I need more time to immerse in a given machine learning problem. In this case it took me 4 weeks and 2 days to find a model I was happy with.\n\nI also want to thanks my teams mates for first 3 weeks, Ahmet and Giba. They preferred to go solo last week but I would have been happy to stick as a team. We used very different models (NN for Ahmet, xgb/lgb for Giba, lr for me) with he hope that together it would work well. It did actually in week2 but we didn't select it at the last minute because of some cv issue. It would have landed us at rank 8th unless mistaken. Week 3 was a bit disappointing for us. \n\nI also warmly thank those who curated the additional datasets I used, especially Vopani. Using these made a difference.\n\nLast but not least I want to congratulate those who did consistently well in these competitions, and especially those who did well in week 4. @david1013 seems to have great models, even when not using an extra day of data if I get his recent posts correctly. It would be interesting to know Lockdown and Kaz model score when not using an extra day as well. Paulo Pinto performance in week 4 is awesome. I can't name all but let me mentions PDD team who did well in several weeks too. \n\n# Modeling Goal\n\nI decided early on to not approach this as I usually build forecasting models. Reason is we are modeling a physical phenomenon where people get infected, then infect others for some time, then either recover or die. I therefore studied [compartmental models used in epidemiology](https://en.wikipedia.org/wiki/Compartmental_models_in_epidemiology), SIR and the like. These models rely on two time series: cases and recoveries/deaths. If we have accurate values for both then we can fit these models and get reasonably accurate predictions. \n\nIssue is we don't have these series. \n\nFor cases we have a proxy, confirmed cases. This is a proxy in many ways:\n- It depends on the testing policy of each geography. Some test a lot, and confirmed cases are close to all cases.\n- A large fraction of sick people are asymptomatic, hence are easily missed by testing.\n- Testing does not happen when people get infected or contagious, it often happens with a delay.\nFor all these reasons the confirmed case nubers we get is a distorted view of actual cases.\n\nFor fatalities the numbers aren't accurate either;\n- In some geos we only get deaths test at hospital, in other geos it includes fatalities from nursing homes.\n- We don't have recoveries data.\nThe latter can be fixed by grabbing recovery data from other online source. This has been done by some top competitors, I wish I had done it.\n\nDespite all these caveat, I assumed that we still have some form of SIR model at play with the two series we have at hand: fatalities depend on cases detected some while ago. That led to my first model.\n\n# Fatalities Prediction Via Linear Regression\n\nIf we assume that fatalities are a proportion of cases from, say, 8 days ago, then the proportion can be computed from log scaled data. See examples below for some countries. Green curve is the difference between confirmed cases (blue) and fatalities 8 days later (orange)\n\nItaly:\n\n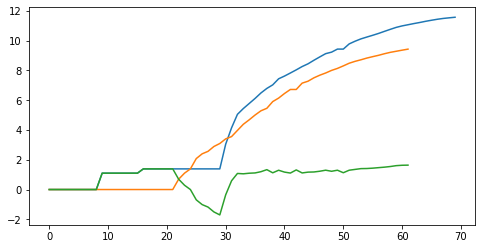\n\n\nFrance:\n\n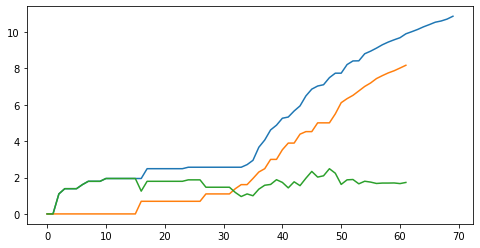\n\nSpain:\n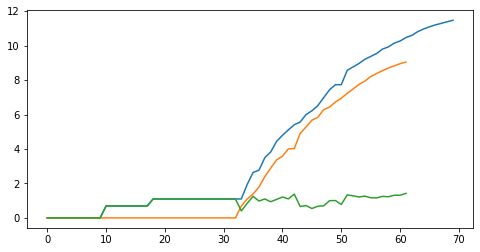\n\nThen running a linear regression on log of past cases as input, and log of fatalities as output should capture this dependency. I published a simplified version in [a notebook](https://www.kaggle.com/cpmpml/fatalities-prediction-via-linear-regression). The above pictures are taken from it.\n\nThe fact that the proportion depends on the geography can be captured via additional input features. In practice I found that log fatalities increase is a linear regression of cases from between 15 to 5 days ago. These limits were tuned via cross validation. They match what researchers say about Covid.\n\n# Cross Validation\n\nWe used time based cross validation for our models. We selected 3 to 5 folds, depending on the week competition. Each fold uses data until a given data for training models, and data after for validation. One fold was defined by the actual test data: validation starts at the first day of test data, even though train and test data overlap.\n\nModels in our team were trained to predict next day. To predict on a longer period we append the prediction to train data, then apply to model on it shifted by one day to get the prediction for the second day. We repeat for all remaining days in validation or test. Other teams trained one model per prediction day. I didn't thought of it but it is definitely doable given how fast training my model is.\n\n# Predicting cases\n\nFor cases I used an auto regressive model, i.e. linear regression using past values as input. That model was not that bad, but it turned out to be pessimistic. The flattening of curves we observed wasn't captured correctly. I spent the last 2 weeks thinking about how to model this. I tried to revisit the epidemiology models, but couldn't find a way to reliably fit them for all geos. I didn't want to add an arbitrary decay, or fit a curve either. I therefore turned back to data exploration. And the day before deadline I found that a log of the decay in daily cases was very interesting, see some plots below.\n\n\n\nIt means that daily cases decrease linearly in the log space. It means that the number of daily cases is of the form N - exp(a t) where N is a starting population, a a constant, and t the number of days. I explain this derivation [here](https://www.kaggle.com/c/covid19-global-forecasting-week-5/discussion/143791).\n\nThe model is therefore fitting a linear model on the log of cases over time. \n\nThis model works well in geos where the number of cases is high, but fails miserably in geos where epidemic starts. I therefore blended it with the previous one, with weights depending on the number of cases a while ago, 12 days if I remember well. This model improved CV scores tremendously compared to the previous one. It was modeling curve flattening rather well, at last.\n\nI then tried the same with fatalities: They indeed decrease linearly in the log space, but the data is sparse: I could fit a linear regression reliably only for geos with a rather large number of cases. Fortunately for people and unfortunately for my model, there were not that many geos like this. Then I realized I could use the same trick as in my very first model: log of fatalities depend linearly on past log cases. I could therefore fit a linear regression on past log cases as input, and log of fatalities as output. I used the same past period, i.e. cases between 15 to 5 days ago more or less (I don't remember the exact figures). My fatalities model is therefore a blend of the original linear model from past cases, a linear regression fit on past log fatalities, and a linear regression fit on past log cases. \n\nThat's what I submitted. \n\n# Post Deadline\n\nI am rather pleased to see that a simple blend of linear models was competitive. I wasn't sure I could handle differences in geos via adaptive weights when blending, but it seems it was good enough.\n\nAfter one day of rest after deadline I realized I could have done a better job. If fatalities depend on the slope of the log of cases, and if that slope is constant, then why estimate it on days from 15 to 5 days before, and not on days from, say 10 days to current day? Using more recent data is always better, then why not here? I implemented this small change and used late submission. This improved model score was similar to the one I submitted in time until last week where it started to outperform it. Its final private Lb score is 0.41840. Bottom line is it took me 4 weeks and 2 days to get the right model...\n\n# Week 5\n\nI contemplated entering week 5 but didn't for 3 reasons. One reason is I was bothered by the extra day data from world odometer. I saw people who used it in week 4 ask for it to be forbidden. It would have been a smart move IMHO. Another reason, more important, is that a one week sprint with changes in competition setting was too short for me. Last reason may be even more important. I think my model works better when there are high level of cases and fatalities. The inclusion of smaller grained geos like US counties probably mean that my model would not be a great fit.\n\nI admire those who entered week 5 and I'm looking forward to their writeups when the competition completes!\n\n\n\n\n\n\n", "votes": 45 }, { "id": 1106654, "postDate": "2020-12-09T02:34:04.643Z", "content": "This felt like reading a story. Falling in love with Kaggle and all these amazing works done by all of you are the reason for it. Thank you for this.
", "rawMarkdown": "This felt like reading a story. Falling in love with Kaggle and all these amazing works done by all of you are the reason for it. Thank you for this.", "votes": 1 }, { "id": 1092325, "postDate": "2020-11-26T17:41:52.160Z", "content": "thanks for sharing! you are showing clearly that even a simple algorithm like linear regression can be very powerful in the right hands :)
", "rawMarkdown": "thanks for sharing! you are showing clearly that even a simple algorithm like linear regression can be very powerful in the right hands :) ", "votes": 1, "replies": [ { "id": 1096999, "postDate": "2020-11-30T23:33:53.460Z", "content": "Simple models are often overlooked in Kaggle competitions ;)
", "rawMarkdown": "Simple models are often overlooked in Kaggle competitions ;)" } ] }, { "id": 856460, "postDate": "2020-05-21T18:09:54.417Z", "content": "awesome
", "rawMarkdown": "awesome", "votes": 1 }, { "id": 853386, "postDate": "2020-05-19T06:29:26.817Z", "content": "Thanks for the writeup, it is impressive visually and good story telling skills.
", "rawMarkdown": "Thanks for the writeup, it is impressive visually and good story telling skills.", "votes": 1 }, { "id": 849532, "postDate": "2020-05-15T21:11:08.067Z", "content": "Congrats for the strong finish!
", "rawMarkdown": "Congrats for the strong finish!", "votes": 1, "replies": [ { "id": 849554, "postDate": "2020-05-15T22:22:22.293Z", "content": "Thanks!
", "rawMarkdown": "Thanks!", "votes": 2 } ] }, { "id": 849264, "postDate": "2020-05-15T15:58:04.803Z", "content": "Thanks for your writeup and great models through the weeks! Sad that your not with us in W5 comp, but maybe we will have a W6, take the best of all the weeks rules/content. We want more teams to collaborate in the mission, there was a steady increase in teams up to w4. I think it could be an idea to extend next deadline if one can't re-use prev models, but shorter/1w if one can.
", "rawMarkdown": "Thanks for your writeup and great models through the weeks! Sad that your not with us in W5 comp, but maybe we will have a W6, take the best of all the weeks rules/content. We want more teams to collaborate in the mission, there was a steady increase in teams up to w4. I think it could be an idea to extend next deadline if one can't re-use prev models, but shorter/1w if one can.", "votes": 1, "replies": [ { "id": 849555, "postDate": "2020-05-15T22:22:53.200Z", "content": "One week was too short for me.
", "rawMarkdown": "One week was too short for me.", "votes": 1 } ] }, { "id": 853429, "postDate": "2020-05-19T07:20:25.630Z", "content": "What a story ! You perfectly described your work. No wonder you rule the Discussions rankings 🥇
", "rawMarkdown": "What a story ! You perfectly described your work. No wonder you rule the Discussions rankings 🥇 ", "votes": 2, "replies": [ { "id": 854547, "postDate": "2020-05-20T05:20:13.750Z", "content": "Thanks. Note that I no longer rule discussion ranking ;)
", "rawMarkdown": "Thanks. Note that I no longer rule discussion ranking ;)", "votes": 2 } ] }, { "id": 849253, "postDate": "2020-05-15T15:50:33.743Z", "content": "Congrats on a strong finish and thanks for sharing the detailed writeup!
", "rawMarkdown": "Congrats on a strong finish and thanks for sharing the detailed writeup!", "votes": 2, "replies": [ { "id": 849433, "postDate": "2020-05-15T18:44:22.883Z", "content": "Thanks, and congrats on the consistent performance across weeks.
", "rawMarkdown": "Thanks, and congrats on the consistent performance across weeks.", "votes": 3 } ] }, { "id": 1697398, "postDate": "2022-02-19T15:48:06.897Z", "content": "it definitely shows that with a creative mind we can use a simple model to get a good result
\nall we should do is to look at our problem from different points of view.
\nwell done👍
Thanks for sharing, very comprehensive and detailed.
", "rawMarkdown": "Thanks for sharing, very comprehensive and detailed." }, { "id": 859793, "postDate": "2020-05-24T18:36:25.383Z", "content": "Nice job using interpretable modeling, thanks for sharing.
", "rawMarkdown": "Nice job using interpretable modeling, thanks for sharing." }, { "id": 1235299, "postDate": "2021-03-12T03:27:28.010Z", "rawMarkdown": "", "isDeleted": true }, { "id": 854494, "postDate": "2020-05-20T04:11:43.067Z", "content": "thanks for sharing, great work.
", "rawMarkdown": "thanks for sharing, great work.\n", "votes": 1 }, { "id": 849262, "postDate": "2020-05-15T15:54:56.170Z", "content": "Thanks, for such details. Nice work.
", "rawMarkdown": "Thanks, for such details. Nice work.\n", "votes": 2 }, { "id": 1388943, "postDate": "2021-07-15T10:19:30.430Z", "content": "Thank you for sharing!
", "rawMarkdown": "Thank you for sharing!" }, { "id": 895393, "postDate": "2020-06-21T10:02:09.940Z", "content": "thanks for sharing, great work
", "rawMarkdown": "thanks for sharing, great work" }, { "id": 856682, "postDate": "2020-05-22T01:41:41.847Z", "content": "Nice job! Thanks for sharing!
", "rawMarkdown": "Nice job! Thanks for sharing!" } ], "complete": true, "source": "live", "fetched_at": "2026-10-20T01:10:33Z", "competition_id": 20010, "competition_slug": "covid19-global-forecasting-week-4", "team_id": 4711051, "solution_url": "/competitions/covid19-global-forecasting-week-4/writeups/no-extra-training-day-linear-regression-is-all-you" }