
Hi, I am still learning R, but I manage to do something. I don't know how to form a team, but it will be nice to talk to you. Here is the github repo.
\n\nThe code calculates splits the image in quadrants. The image can splited in 3x3 like a hashtag or in different dimensions. Then for each dimension it calculates some statistical variable. Mean, Standard Deviation, Skewness and Kurtosis. then randomForest.
\n\nI rekon that I barely undertand the concept of Kurtosis. The fun of machine learning is that it might show some success even if you don't know that properly. If something is unknow, it is possible to go after it to understand.
\n\nThe system calculates its variables for each row and create a new data frame of features. It binds the label and is passed trough a randomForest.
\n\nNo parameters to the randomForest are set yet. The most I did was make some changes on ntree. It shows improvement as it increases, but not meaningfull to worth the brute force.
\n\nI also tried different breaks and checked the error rate for each one. It seems there isn't many differences in split the image of more than 4 breaks. And as the image is more fragmented, more processor time is taken. You can see in the char the error rate against numbers of breaks.\n
With a better setup: breaks = 4, I train all the dataset. It got around 12% of error. Poorly one, I know. But it was fun, considering it uses only generated features.
\n\nCall:\n randomForest(formula = label ~ ., data = data) \n Type of random forest: classification\n Number of trees: 500\nNo. of variables tried at each split: 5\n\n OOB estimate of error rate: 12.37%\nConfusion matrix:\n 0 1 2 3 4 5 6 7 8 9 class.error\n0 3724 34 22 17 3 26 63 2 241 0 0.09874153\n1 14 4508 25 27 12 5 26 11 47 9 0.03757472\n2 38 4 3449 281 25 236 83 9 47 5 0.17428777\n3 26 24 182 3600 16 223 15 86 110 69 0.17260400\n4 6 8 29 3 3696 16 24 42 14 234 0.09233792\n5 37 18 209 398 22 2879 43 65 106 18 0.24137022\n6 42 6 103 4 16 30 3873 0 63 0 0.06381436\n7 4 23 17 32 71 19 0 4010 39 186 0.08884344\n8 159 75 34 119 15 150 32 37 3415 27 0.15948806\n9 18 16 13 80 179 10 0 167 53 3652 0.12798472\nIt's a little bit messy yet, but I will work some more, but it can me delayed. I am kind of busy trying to set up the first robo advisor in my country.
", "messages": [ { "id": 99691, "postDate": "2015-11-28T14:04:55.563Z", "content": "Hi, I am still learning R, but I manage to do something. I don't know how to form a team, but it will be nice to talk to you. Here is the github repo.
\n\nThe code calculates splits the image in quadrants. The image can splited in 3x3 like a hashtag or in different dimensions. Then for each dimension it calculates some statistical variable. Mean, Standard Deviation, Skewness and Kurtosis. then randomForest.
\n\nI rekon that I barely undertand the concept of Kurtosis. The fun of machine learning is that it might show some success even if you don't know that properly. If something is unknow, it is possible to go after it to understand.
\n\nThe system calculates its variables for each row and create a new data frame of features. It binds the label and is passed trough a randomForest.
\n\nNo parameters to the randomForest are set yet. The most I did was make some changes on ntree. It shows improvement as it increases, but not meaningfull to worth the brute force.
\n\nI also tried different breaks and checked the error rate for each one. It seems there isn't many differences in split the image of more than 4 breaks. And as the image is more fragmented, more processor time is taken. You can see in the char the error rate against numbers of breaks.\n
With a better setup: breaks = 4, I train all the dataset. It got around 12% of error. Poorly one, I know. But it was fun, considering it uses only generated features.
\n\nCall:\n randomForest(formula = label ~ ., data = data) \n Type of random forest: classification\n Number of trees: 500\nNo. of variables tried at each split: 5\n\n OOB estimate of error rate: 12.37%\nConfusion matrix:\n 0 1 2 3 4 5 6 7 8 9 class.error\n0 3724 34 22 17 3 26 63 2 241 0 0.09874153\n1 14 4508 25 27 12 5 26 11 47 9 0.03757472\n2 38 4 3449 281 25 236 83 9 47 5 0.17428777\n3 26 24 182 3600 16 223 15 86 110 69 0.17260400\n4 6 8 29 3 3696 16 24 42 14 234 0.09233792\n5 37 18 209 398 22 2879 43 65 106 18 0.24137022\n6 42 6 103 4 16 30 3873 0 63 0 0.06381436\n7 4 23 17 32 71 19 0 4010 39 186 0.08884344\n8 159 75 34 119 15 150 32 37 3415 27 0.15948806\n9 18 16 13 80 179 10 0 167 53 3652 0.12798472\nIt's a little bit messy yet, but I will work some more, but it can me delayed. I am kind of busy trying to set up the first robo advisor in my country.
", "rawMarkdown": "Hi, I am still learning R, but I manage to do something. I don't know how to form a team, but it will be nice to talk to you. Here is the [github repo](https://github.com/resendedaniel/digits).\r\n\r\nThe code calculates splits the image in quadrants. The image can splited in 3x3 like a hashtag or in different dimensions. Then for each dimension it calculates some statistical variable. Mean, Standard Deviation, Skewness and Kurtosis. then randomForest.\r\n\r\nI rekon that I barely undertand the concept of Kurtosis. The fun of machine learning is that it might show some success even if you don't know that properly. If something is unknow, it is possible to go after it to understand.\r\n\r\nThe system calculates its variables for each row and create a new data frame of features. It binds the label and is passed trough a randomForest.\r\n\r\nNo parameters to the randomForest are set yet. The most I did was make some changes on ntree. It shows improvement as it increases, but not meaningfull to worth the brute force.\r\n\r\nI also tried different breaks and checked the error rate for each one. It seems there isn't many differences in split the image of more than 4 breaks. And as the image is more fragmented, more processor time is taken. You can see in the char the error rate against numbers of breaks.\r\n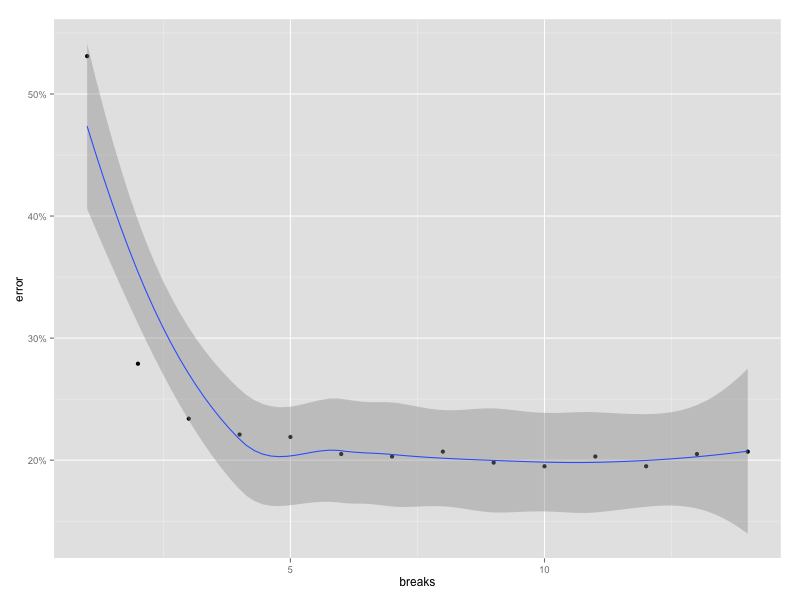\r\n\r\nWith a better setup: breaks = 4, I train all the dataset. It got around 12% of error. Poorly one, I know. But it was fun, considering it uses only generated features.\r\n\r\n Call:\r\n randomForest(formula = label ~ ., data = data) \r\n Type of random forest: classification\r\n Number of trees: 500\r\n No. of variables tried at each split: 5\r\n \r\n OOB estimate of error rate: 12.37%\r\n Confusion matrix:\r\n 0 1 2 3 4 5 6 7 8 9 class.error\r\n 0 3724 34 22 17 3 26 63 2 241 0 0.09874153\r\n 1 14 4508 25 27 12 5 26 11 47 9 0.03757472\r\n 2 38 4 3449 281 25 236 83 9 47 5 0.17428777\r\n 3 26 24 182 3600 16 223 15 86 110 69 0.17260400\r\n 4 6 8 29 3 3696 16 24 42 14 234 0.09233792\r\n 5 37 18 209 398 22 2879 43 65 106 18 0.24137022\r\n 6 42 6 103 4 16 30 3873 0 63 0 0.06381436\r\n 7 4 23 17 32 71 19 0 4010 39 186 0.08884344\r\n 8 159 75 34 119 15 150 32 37 3415 27 0.15948806\r\n 9 18 16 13 80 179 10 0 167 53 3652 0.12798472\r\n\r\nIt's a little bit messy yet, but I will work some more, but it can me delayed. I am kind of busy trying to set up the first robo advisor in my country." } ], "comments": [], "raw_markdown_by_id": { "99691": "Hi, I am still learning R, but I manage to do something. I don't know how to form a team, but it will be nice to talk to you. Here is the [github repo](https://github.com/resendedaniel/digits).\r\n\r\nThe code calculates splits the image in quadrants. The image can splited in 3x3 like a hashtag or in different dimensions. Then for each dimension it calculates some statistical variable. Mean, Standard Deviation, Skewness and Kurtosis. then randomForest.\r\n\r\nI rekon that I barely undertand the concept of Kurtosis. The fun of machine learning is that it might show some success even if you don't know that properly. If something is unknow, it is possible to go after it to understand.\r\n\r\nThe system calculates its variables for each row and create a new data frame of features. It binds the label and is passed trough a randomForest.\r\n\r\nNo parameters to the randomForest are set yet. The most I did was make some changes on ntree. It shows improvement as it increases, but not meaningfull to worth the brute force.\r\n\r\nI also tried different breaks and checked the error rate for each one. It seems there isn't many differences in split the image of more than 4 breaks. And as the image is more fragmented, more processor time is taken. You can see in the char the error rate against numbers of breaks.\r\n\r\n\r\nWith a better setup: breaks = 4, I train all the dataset. It got around 12% of error. Poorly one, I know. But it was fun, considering it uses only generated features.\r\n\r\n Call:\r\n randomForest(formula = label ~ ., data = data) \r\n Type of random forest: classification\r\n Number of trees: 500\r\n No. of variables tried at each split: 5\r\n \r\n OOB estimate of error rate: 12.37%\r\n Confusion matrix:\r\n 0 1 2 3 4 5 6 7 8 9 class.error\r\n 0 3724 34 22 17 3 26 63 2 241 0 0.09874153\r\n 1 14 4508 25 27 12 5 26 11 47 9 0.03757472\r\n 2 38 4 3449 281 25 236 83 9 47 5 0.17428777\r\n 3 26 24 182 3600 16 223 15 86 110 69 0.17260400\r\n 4 6 8 29 3 3696 16 24 42 14 234 0.09233792\r\n 5 37 18 209 398 22 2879 43 65 106 18 0.24137022\r\n 6 42 6 103 4 16 30 3873 0 63 0 0.06381436\r\n 7 4 23 17 32 71 19 0 4010 39 186 0.08884344\r\n 8 159 75 34 119 15 150 32 37 3415 27 0.15948806\r\n 9 18 16 13 80 179 10 0 167 53 3652 0.12798472\r\n\r\nIt's a little bit messy yet, but I will work some more, but it can me delayed. I am kind of busy trying to set up the first robo advisor in my country." } }