# %% [markdown]
# # Importing

# %% [code] {"execution":{"iopub.status.busy":"2021-12-01T07:31:35.39848Z","iopub.execute_input":"2021-12-01T07:31:35.398807Z","iopub.status.idle":"2021-12-01T07:31:35.415277Z","shell.execute_reply.started":"2021-12-01T07:31:35.398771Z","shell.execute_reply":"2021-12-01T07:31:35.414328Z"}}
import numpy as np 
import pandas as pd 

import plotly.graph_objects as go
from plotly.subplots import make_subplots

import cufflinks as cf
cf.go_offline()

import os
for dirname, _, filenames in os.walk('/kaggle/input'):
    for filename in filenames:
        print(os.path.join(dirname, filename))

# %% [code] {"execution":{"iopub.status.busy":"2021-12-01T07:31:35.417136Z","iopub.execute_input":"2021-12-01T07:31:35.417542Z","iopub.status.idle":"2021-12-01T07:32:15.112165Z","shell.execute_reply.started":"2021-12-01T07:31:35.417508Z","shell.execute_reply":"2021-12-01T07:32:15.111239Z"}}
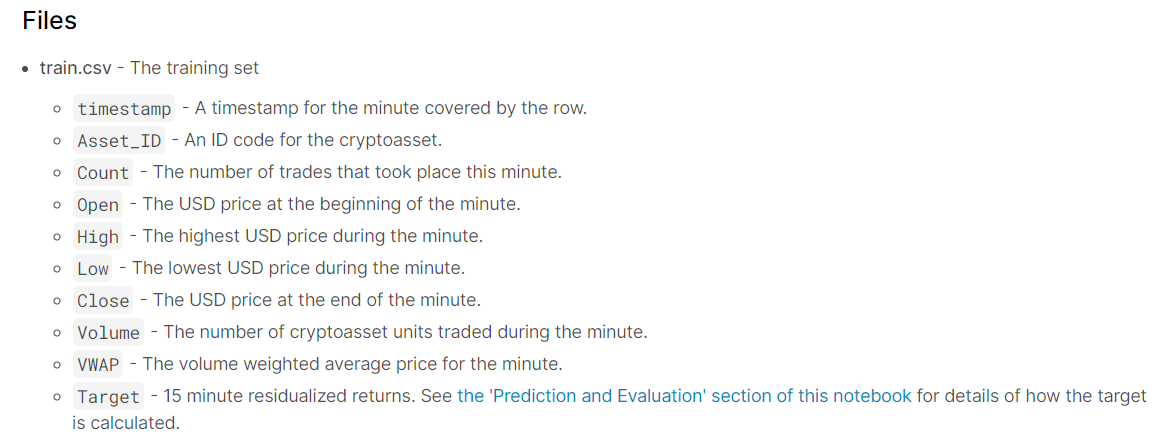
data = pd.read_csv('/kaggle/input/g-research-crypto-forecasting/train.csv')
data.head(10).style.applymap(lambda x : "background-color: #f5cb98")

# %% [markdown]
# <div align="center">
#   <img width="900"  src="https://i.postimg.cc/k51YWshq/image.png">
# </div>

# %% [code] {"execution":{"iopub.status.busy":"2021-12-01T07:32:15.11341Z","iopub.execute_input":"2021-12-01T07:32:15.113623Z","iopub.status.idle":"2021-12-01T07:33:40.486551Z","shell.execute_reply.started":"2021-12-01T07:32:15.113598Z","shell.execute_reply":"2021-12-01T07:33:40.485653Z"}}
def EDA(df):
    
    print('\033[1m' +'EXPLORATORY DATA ANALYSIS :'+ '\033[0m\n')
    print('\033[1m' + 'Shape of the data :' + '\033[0m')
    print(df.shape, 
          '\n------------------------------------------------------------------------------------\n')
    
    print('\033[1m' + 'All columns from the dataframe :' + '\033[0m')
    print(df.columns, 
          '\n------------------------------------------------------------------------------------\n')
    
    print('\033[1m' + 'Datatpes and Missing values:' + '\033[0m')
    print(df.info(), 
          '\n------------------------------------------------------------------------------------\n')
    
    print('\033[1m' + 'Summary statistics for the data :' + '\033[0m')
    print(df.describe(include='all'), 
          '\n------------------------------------------------------------------------------------\n')
    
        
    print('\033[1m' + 'Memory used by the data :' + '\033[0m')
    print(df.memory_usage(), 
          '\n------------------------------------------------------------------------------------\n')
    
    print('\033[1m' + 'Number of duplicate values :' + '\033[0m')
    print(df.duplicated().sum())
          
EDA(data)

# %% [code] {"execution":{"iopub.status.busy":"2021-12-01T07:33:40.488322Z","iopub.execute_input":"2021-12-01T07:33:40.488553Z","iopub.status.idle":"2021-12-01T07:34:08.127466Z","shell.execute_reply.started":"2021-12-01T07:33:40.488517Z","shell.execute_reply":"2021-12-01T07:34:08.126538Z"}}
# Naming every asset

asset_name = ['Binance Coin', 'Bitcoin', 'Bitcoin Cash', 'Cardano', 'Dogecoin', 'EOS.IO', 'Ethereum', 
              'Ethereum Classic', 'IOTA', 'Litecoin', 'Maker', 'Monero', 'Stellar', 'TRON']

for index in range(0,14):
    data['Asset_ID'].replace({index : asset_name[index]}, inplace=True)
    
names = data.Asset_ID.unique()
names

# %% [code] {"execution":{"iopub.status.busy":"2021-12-01T07:34:08.128935Z","iopub.execute_input":"2021-12-01T07:34:08.129224Z","iopub.status.idle":"2021-12-01T07:34:09.571986Z","shell.execute_reply.started":"2021-12-01T07:34:08.129184Z","shell.execute_reply":"2021-12-01T07:34:09.571102Z"}}
# Making timestamp column the index 

data['timestamp'] = pd.to_datetime(data['timestamp'], unit='s')
data.set_index('timestamp', inplace = True)
data.index.dtype

# %% [code] {"execution":{"iopub.status.busy":"2021-12-01T07:34:09.573381Z","iopub.execute_input":"2021-12-01T07:34:09.573692Z","iopub.status.idle":"2021-12-01T07:34:12.996877Z","shell.execute_reply.started":"2021-12-01T07:34:09.573645Z","shell.execute_reply":"2021-12-01T07:34:12.995981Z"}}
# Reducing memory taken by the data

def reduce_memory(df):
    
    before = df.memory_usage().sum()  
    
    for col in df.columns:        
        dtype = df[col].dtype
        if dtype == 'float64':
            c_min = df[col].min()
            c_max = df[col].max()        
            if c_min > np.finfo(np.float32).min and c_max < np.finfo(np.float32).max:
                df[col] = df[col].astype(np.float32)
            else:
                df[col] = df[col].astype(np.float64)    
                    
    after = df.memory_usage().sum()
    
    print('Memory taken before transformation : ', before)
    print('Memory taken after transformation : ', after)
    print('Memory taken reduced by : ',( before - after) * 100/ before, '%')
    
    return df

data = reduce_memory(data)

# %% [code] {"_kg_hide-input":true,"execution":{"iopub.status.busy":"2021-12-01T07:34:12.998236Z","iopub.execute_input":"2021-12-01T07:34:12.998533Z","iopub.status.idle":"2021-12-01T07:34:35.89754Z","shell.execute_reply.started":"2021-12-01T07:34:12.998494Z","shell.execute_reply":"2021-12-01T07:34:35.896892Z"}}
# Making separate dataframes

bitcoin_cash = data[data['Asset_ID'] == 'Bitcoin Cash']
binance_coin = data[data['Asset_ID'] == 'Binance Coin']
bitcoin = data[data['Asset_ID'] == 'Bitcoin']
eos_io = data[data['Asset_ID'] == 'EOS.IO']
ethereum_classic = data[data['Asset_ID'] == 'Ethereum Classic']
ethereum = data[data['Asset_ID'] == 'Ethereum']
litecoin = data[data['Asset_ID'] == 'Litecoin']
monero = data[data['Asset_ID'] == 'Monero']
tron = data[data['Asset_ID'] == 'TRON']
stellar = data[data['Asset_ID'] == 'Stellar']
cardano = data[data['Asset_ID'] == 'Cardano']
iota = data[data['Asset_ID'] == 'IOTA']
maker = data[data['Asset_ID'] == 'Maker']
dogecoin = data[data['Asset_ID'] == 'Dogecoin']

# Clearing memory
del data

# %% [code] {"_kg_hide-input":true,"execution":{"iopub.status.busy":"2021-12-01T07:34:35.899045Z","iopub.execute_input":"2021-12-01T07:34:35.899524Z","iopub.status.idle":"2021-12-01T07:34:36.960145Z","shell.execute_reply.started":"2021-12-01T07:34:35.899469Z","shell.execute_reply":"2021-12-01T07:34:36.959496Z"}}
# Resampling all datasets

day = {
    'Open': 'first',
    'High': 'max',
    'Low': 'min',
    'Close': 'last',
    'Volume': 'sum'
}

bitcoin_cash = bitcoin_cash.resample('D').apply(day)
binance_coin = binance_coin.resample('D').apply(day)
bitcoin = bitcoin.resample('D').apply(day)
eos_io = eos_io.resample('D').apply(day)
ethereum_classic = ethereum_classic.resample('D').apply(day)
ethereum = ethereum.resample('D').apply(day)
litecoin = litecoin.resample('D').apply(day)
monero = monero.resample('D').apply(day)
tron = tron.resample('D').apply(day)
stellar = stellar.resample('D').apply(day)
cardano = cardano.resample('D').apply(day)
iota = iota.resample('D').apply(day)
maker = maker.resample('D').apply(day)
dogecoin = dogecoin.resample('D').apply(day)

df_list = [bitcoin_cash, binance_coin, bitcoin, eos_io, ethereum_classic, ethereum,
           litecoin, monero, tron, stellar, cardano, iota, maker, dogecoin]

# %% [code] {"_kg_hide-input":true,"execution":{"iopub.status.busy":"2021-12-01T07:34:36.962543Z","iopub.execute_input":"2021-12-01T07:34:36.962949Z","iopub.status.idle":"2021-12-01T07:34:37.464263Z","shell.execute_reply.started":"2021-12-01T07:34:36.962905Z","shell.execute_reply":"2021-12-01T07:34:37.463398Z"}}
date_buttons = [
{'count':  4, 'step': "year", 'stepmode': "todate", 'label': "Year"},
{'count':  6, 'step': "month", 'stepmode': "todate", 'label': "Month"},
{'count': 60, 'step': "day", 'stepmode': "todate", 'label': "Week"},
{'count': 20, 'step': "day", 'stepmode': "todate", 'label': "Day"},
               ]


buttons = []
i = 0
vis = [False] * 14

for df in df_list:
    vis[i] = True
    buttons.append({ 'label' : names[i],
                     'method' : 'update',
                     'args'   : [{'visible' : vis},
                                 {'title'  : names[i] + ' Chart'}] })
    i+=1
    vis = [False] * 14

fig = go.Figure()

for df in df_list:
    fig.add_trace(go.Candlestick(x     = df.index,
                                 open  = df['Open'],
                                 high  = df['High'],
                                 low   = df['Low'],
                                 close = df['Close'],
                                 increasing_line_color= '#42eff5',
                                 decreasing_line_color= '#8f4040'))

fig.update_xaxes(
        tickfont = dict(size=15, family = 'monospace', color='#B8B8B8'),
        tickmode = 'array',
        ticklen = 6,
        showline = False,
        showgrid = True,
        gridcolor = '#595959',
        ticks = 'outside')

fig.update_yaxes(
        tickfont = dict(size=15, family = 'monospace', color='#B8B8B8'),
        tickmode = 'array',
        showline = False,
        ticksuffix = '$',
        showgrid = True,
        gridcolor = '#595959',
        ticks = 'outside')    
    
    
fig.update_layout(height = 650,
                  font_family   = 'monospace',
                  xaxis         = dict(rangeselector = dict(buttons = date_buttons)),
                  updatemenus   = [dict(type = 'dropdown',
                                        x = 1,
                                        y = 1.15,
                                        showactive = True,
                                        active = 2,
                                        buttons = buttons)],
                  title         = dict(text = 'Crypto Pvrple Candlestick<br>Dashboard',
                                       font = dict(color = '#FFFFFF'), 
                                       x = 0.525),
                  plot_bgcolor  = '#1a253d',
                  paper_bgcolor = '#1a253d',
                  font          = dict(color='#858585'), 
                  annotations   = [
                                  dict( text = "<b>Choose<br>Crypto<b> : ",
                                        font = dict(size = 12),
                                        showarrow=False,
                                        x = 0.96, y = 1.25,
                                        xref = 'paper', yref = "paper",
                                        align = "left")])
    
    
for i in range(0,14):
    fig.data[i].visible = False
fig.data[2].visible = True

fig.show()

# %% [code] {"_kg_hide-input":true,"execution":{"iopub.status.busy":"2021-12-01T07:34:37.465534Z","iopub.execute_input":"2021-12-01T07:34:37.465927Z","iopub.status.idle":"2021-12-01T07:34:38.341969Z","shell.execute_reply.started":"2021-12-01T07:34:37.465896Z","shell.execute_reply":"2021-12-01T07:34:38.341133Z"}}
date_buttons = [
{'count':  4, 'step': "year", 'stepmode': "backward", 'label': "Year"},
{'count':  6, 'step': "month", 'stepmode': "todate", 'label': "Month"},
{'count': 60, 'step': "day", 'stepmode': "todate", 'label': "Week"},
{'count': 20, 'step': "day", 'stepmode': "todate", 'label': "Day"},
               ]

fig = make_subplots(rows=2, cols=1, shared_xaxes=True, 
               vertical_spacing=0.3, subplot_titles=('', 'Volume'), row_width=[0.3, 0.8])


buttons = []
i = 0
vis = [False] * 14

for df in df_list:
    vis[i] = True
    buttons.append({ 'label' : names[i],
                     'method' : 'update',
                     'args'   : [{'visible' : vis},
                                 {'title'  : names[i] + ' Linechart'}] })
    i+=1
    vis = [False] * 14


for df in df_list:
    fig.add_trace(go.Scatter(x = df.index,
                             y = df['Open'],
                             mode = 'lines',
                             marker =  dict(color = '#44eff2')), row=1, col=1)
    
for df in df_list:
    fig.add_trace(go.Bar(x = df.index,
                         y = df['Volume'],
                         marker =  dict(color = '#94afb0')), row=2, col=1)

fig.update_xaxes(
        tickfont = dict(size=15, family = 'monospace', color='#B8B8B8'),
        tickmode = 'array',
        ticklen = 6,
        showline = False,
        showgrid = True,
        gridcolor = '#595959',
        ticks = 'outside')

fig.update_yaxes(
        tickfont = dict(size=15, family = 'monospace', color='#B8B8B8'),
        tickmode = 'array',
        showline = False,
        showgrid = True,
        gridcolor = '#595959',
        ticks = 'outside')    
    
    
fig.update_layout(showlegend = False,
                  height = 650,
                  font_family   = 'monospace',
                  xaxis         = dict(rangeselector = dict(buttons = date_buttons)),
                  updatemenus   = [dict(type = 'dropdown',
                                        x = 1,
                                        y = 1.15,
                                        showactive = True,
                                        active = 0,
                                        buttons = buttons)],
                  title         = dict(text = 'Crypto Pvrple Linechart Dashboard<br>with Volumes',
                                       font = dict(color = '#FFFFFF'), 
                                       x = 0.5),
                  plot_bgcolor  = '#1a253d',
                  paper_bgcolor = '#1a253d',
                  font          = dict(color='#858585'),
                  annotations   = [dict(text = "Choose Crypto :",
                                        font = dict(size = 10, color ='#44eff2'),
                                        showarrow=False,
                                        x = 1, y = 1.25,
                                        xref = 'paper', yref = "paper",
                                        align = "left"),                                
                                   dict(text = "<----DRAG HERE TO MOVE---->",
                                        font = dict(size = 10, color ='#44eff2'),
                                        showarrow=False,
                                        x = 0.5, y = 0.45,
                                        xref = 'paper', yref = "paper",
                                        align = "left")])

for i in range(1,14):
    fig.data[i].visible = False

fig.show()

# %% [code] {"_kg_hide-input":true,"execution":{"iopub.status.busy":"2021-12-01T07:34:38.343597Z","iopub.execute_input":"2021-12-01T07:34:38.343984Z","iopub.status.idle":"2021-12-01T07:34:38.356617Z","shell.execute_reply.started":"2021-12-01T07:34:38.343952Z","shell.execute_reply":"2021-12-01T07:34:38.356038Z"}}
def indicators(df=None, title='Chart', symbol = 'Candlesticks'):
    
    layout1 = cf.Layout(height=1250,
                  font_family   = 'monospace',
                  xaxis         = dict( rangeselector = dict(buttons = date_buttons),
                                        tickfont = dict(size=12, color='#d4d4d4'),
                                        tickmode = 'array',
                                        ticklen = 6,
                                        showline = False,
                                        showgrid = True,
                                        gridcolor = '#595959',
                                        ticks = 'outside'),

                  yaxis         = dict(
                                       tickfont = dict(size=15, color='#d4d4d4'),
                                        tickmode = 'array',
                                        showline = False,
                                        ticksuffix = '$',
                                        showgrid = True,
                                        gridcolor = '#595959',
                                        ticks = 'outside'),

                  title         = dict(text = '{} Pvrple chart<br>with Indicators'.format(title),
                                       font = dict(color = '#FFFFFF'), 
                                       x = 0.5),
                    
                  legend        = dict(orientation="h",
                                       yanchor="bottom", y=0.92,
                                       xanchor="center", x=0.5),
                                       
                  plot_bgcolor  = '#1a253d',
                  paper_bgcolor = '#1a253d',
                  font          = dict(color='#858585'),
                  annotations   = [dict(text = " ",
                                        font = dict(size = 1, color ='white'),
                                        showarrow=False,
                                        x = 1, y = 1.25,
                                        xref = 'paper', yref = "paper",
                                        align = "left"),                                
                                   dict(text = "RSI",
                                        font = dict(size = 15, color ='white'),
                                        showarrow=False,
                                        x = 0.5, y = 0.62,
                                        xref = 'paper', yref = "paper",
                                        align = "left"),
                                   dict(text = "Volume",
                                        font = dict(size = 15, color ='white'),
                                        showarrow=False,
                                        x = 0.5, y = 0.38,
                                        xref = 'paper', yref = "paper",
                                        align = "left"),
                                   dict(text = "MACD",
                                        font = dict(size = 15, color ='white'),
                                        showarrow=False,
                                        x = 0.5, y = 0.14,
                                        xref = 'paper', yref = "paper",
                                        align = "left"),
                                   dict(text = "<-----SLIDER----->",
                                        font = dict(size = 15, color ='white'),
                                        showarrow=False,
                                        x = 0.5, y = -0.06,
                                        xref = 'paper', yref = "paper",
                                        align = "left")]
                       )
    
    qf = cf.QuantFig(df, name = symbol, down_color='red')

    qf.add_sma([100], width=2, color=['white'])

    qf.add_rsi(periods=14, color='#b876b3')

    qf.add_volume(color='#999999')

    qf.add_macd(color = ['yellow', 'blue'])

    qf.add_bollinger_bands(periods=20, boll_std=2 ,colors=['orange','grey'], fill=True)

    qf.iplot(layout = layout1)

# %% [code] {"execution":{"iopub.status.busy":"2021-12-01T07:34:38.357582Z","iopub.execute_input":"2021-12-01T07:34:38.358002Z","iopub.status.idle":"2021-12-01T07:34:39.286966Z","shell.execute_reply.started":"2021-12-01T07:34:38.357961Z","shell.execute_reply":"2021-12-01T07:34:39.285955Z"}}
indicators(bitcoin, title='Bitcoin', symbol='BTC')

# %% [code] {"execution":{"iopub.status.busy":"2021-12-01T07:34:39.288607Z","iopub.execute_input":"2021-12-01T07:34:39.288906Z","iopub.status.idle":"2021-12-01T07:34:40.213715Z","shell.execute_reply.started":"2021-12-01T07:34:39.288869Z","shell.execute_reply":"2021-12-01T07:34:40.212894Z"}}
indicators(ethereum, title='Ethereum', symbol='ETH')

# %% [code] {"execution":{"iopub.status.busy":"2021-12-01T07:34:40.215095Z","iopub.execute_input":"2021-12-01T07:34:40.215324Z","iopub.status.idle":"2021-12-01T07:34:41.131888Z","shell.execute_reply.started":"2021-12-01T07:34:40.215298Z","shell.execute_reply":"2021-12-01T07:34:41.131113Z"}}
indicators(litecoin, title='Litecoin', symbol='LTC')

# %% [code] {"execution":{"iopub.status.busy":"2021-12-01T07:34:41.133279Z","iopub.execute_input":"2021-12-01T07:34:41.133695Z","iopub.status.idle":"2021-12-01T07:34:42.023003Z","shell.execute_reply.started":"2021-12-01T07:34:41.133658Z","shell.execute_reply":"2021-12-01T07:34:42.022176Z"}}
indicators(iota, title='IOTA', symbol='IOTA')

# %% [code] {"execution":{"iopub.status.busy":"2021-12-01T07:34:42.024501Z","iopub.execute_input":"2021-12-01T07:34:42.025017Z","iopub.status.idle":"2021-12-01T07:34:42.934858Z","shell.execute_reply.started":"2021-12-01T07:34:42.024979Z","shell.execute_reply":"2021-12-01T07:34:42.933997Z"}}
indicators(bitcoin_cash, title='Bitcoin Cash', symbol='BCH')

# %% [code] {"execution":{"iopub.status.busy":"2021-12-01T07:34:42.935996Z","iopub.execute_input":"2021-12-01T07:34:42.936292Z","iopub.status.idle":"2021-12-01T07:34:43.842625Z","shell.execute_reply.started":"2021-12-01T07:34:42.936262Z","shell.execute_reply":"2021-12-01T07:34:43.841831Z"}}
indicators(ethereum_classic, title='Ethereum Classic', symbol='Ξ')

# %% [code] {"execution":{"iopub.status.busy":"2021-12-01T07:34:43.843701Z","iopub.execute_input":"2021-12-01T07:34:43.84391Z","iopub.status.idle":"2021-12-01T07:34:44.800195Z","shell.execute_reply.started":"2021-12-01T07:34:43.843886Z","shell.execute_reply":"2021-12-01T07:34:44.798892Z"}}
indicators(monero, title='Monero', symbol='XMR')

# %% [code] {"execution":{"iopub.status.busy":"2021-12-01T07:34:44.801763Z","iopub.execute_input":"2021-12-01T07:34:44.802306Z","iopub.status.idle":"2021-12-01T07:34:45.479186Z","shell.execute_reply.started":"2021-12-01T07:34:44.802265Z","shell.execute_reply":"2021-12-01T07:34:45.478549Z"}}
indicators(dogecoin, title='Dogecoin', symbol='Ð')

# %% [code] {"execution":{"iopub.status.busy":"2021-12-01T07:34:45.480105Z","iopub.execute_input":"2021-12-01T07:34:45.480496Z","iopub.status.idle":"2021-12-01T07:34:46.576218Z","shell.execute_reply.started":"2021-12-01T07:34:45.480465Z","shell.execute_reply":"2021-12-01T07:34:46.575353Z"}}
indicators(tron, title='TRON', symbol='TRON')

# %% [code] {"execution":{"iopub.status.busy":"2021-12-01T07:34:46.577448Z","iopub.execute_input":"2021-12-01T07:34:46.577682Z","iopub.status.idle":"2021-12-01T07:34:47.497301Z","shell.execute_reply.started":"2021-12-01T07:34:46.577653Z","shell.execute_reply":"2021-12-01T07:34:47.496543Z"}}
indicators(eos_io, title='EOS.IO', symbol='EOS')

# %% [code] {"execution":{"iopub.status.busy":"2021-12-01T07:34:47.498421Z","iopub.execute_input":"2021-12-01T07:34:47.498654Z","iopub.status.idle":"2021-12-01T07:34:48.419912Z","shell.execute_reply.started":"2021-12-01T07:34:47.498625Z","shell.execute_reply":"2021-12-01T07:34:48.419074Z"}}
indicators(binance_coin, title='Binance Coin', symbol='BNB ')

# %% [code] {"execution":{"iopub.status.busy":"2021-12-01T07:34:48.421092Z","iopub.execute_input":"2021-12-01T07:34:48.421315Z","iopub.status.idle":"2021-12-01T07:34:49.367889Z","shell.execute_reply.started":"2021-12-01T07:34:48.421287Z","shell.execute_reply":"2021-12-01T07:34:49.367299Z"}}
indicators(stellar, title='Stellar', symbol='XLM')

# %% [code] {"execution":{"iopub.status.busy":"2021-12-01T07:34:49.370198Z","iopub.execute_input":"2021-12-01T07:34:49.370696Z","iopub.status.idle":"2021-12-01T07:34:50.256558Z","shell.execute_reply.started":"2021-12-01T07:34:49.370664Z","shell.execute_reply":"2021-12-01T07:34:50.255647Z"}}
indicators(cardano, title='Cardano', symbol='ADA')

# %% [code] {"execution":{"iopub.status.busy":"2021-12-01T07:34:50.257659Z","iopub.execute_input":"2021-12-01T07:34:50.257905Z","iopub.status.idle":"2021-12-01T07:34:51.156774Z","shell.execute_reply.started":"2021-12-01T07:34:50.257874Z","shell.execute_reply":"2021-12-01T07:34:51.156028Z"}}
indicators(maker, title='Maker', symbol='MAKE')

# %% [markdown]
# # Thank you
# * Thanks for sitting through my notebook.
# * Pvrple
#