The competition involves using histone mark data to predict gene expression values in a total of 56 cell types across 17447 genes. The data is split into a training set and evaluation set. The training set contains the histone marks and expression values for 50 cell types and 16000 genes. The evaluation set contains **only the histone marks** for the 6 held-out cell types across all genes and the marks for 1447 held-out genes for the 50 cell types.
\nThe histone marks in the data are H3K27me3, H3K36me3, H3K4me1, H3K4me3, H3K9me3. These 5 marks are quantified counting the number of occurrences in bins of length 100 base pairs (bp) selected from regions (+/- 5000 bp) flanking the transcription start site (TSS) of each gene. There are in total 100 contiguous bins for each gene, and 5 read counts of the histone marks per bin.
\nGene expression values are quantified via RNA sequencing to identify the amount of gene transcript present. RNAseq provides read counts that can be used to create an expression matrix across all genes in the cell. Since total gene expression in different cell lines are not equivalent, expression values are measured as the difference from a \"reference\" expression matrix produced from the RNA of 10 cell lines combined.
\n\nThe data is in a numpy object (.npz) and can be loaded as shown in the provided script. Each cell type has an array of shape (#genes, 100, 7). Thus, each gene corresponds to a 100 by 7 matrix, where each of the 100 rows corresponds to a bin, and the columns are [GeneID, H3K27me3, H3K36me3, H3K4me1, H3K4me3, H3K9me3, Expression Value]. Column 0 gene ID should not be used in training the regression model.
\nThe histone counts have been normalized using ln(1 + counts) in order to account for large deviations in frequency. These values will be >=0.
\nThe expression values were obtained by first calculating the difference from the reference expression matrix ('Cell type-X expression' - 'Ref expression'). If this difference was negative, it was further normalized by -ln(1 - 'expression difference'). If it was positive, it was normalized by ln(1 + 'expression difference'). The final expression values are real numbers that can be both negative or positive. In this way, the prediction task is such that the network learns to identify how the unique cell-line's histone marks result in deviations from a reference expression value. This accounts for the natural variation in the expression amounts between different genes. <\\p>\n\n
\n
In humans and most eukaryotes, nuclear DNA is often kept repressed by default, bound in the structure of a supercoil. This is a coiled coil of DNA that is wrapped around histones at regular intervals of around 146 base pairs. Each of the histone \"beads\" on the DNA \"string\" is referred to as a nucleosome.
\n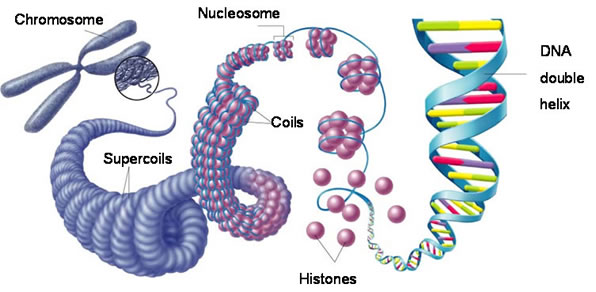\n\n\nFor genes to be expressed, the DNA to be transcribed into RNA by RNA polymerase. Since most DNA is in the compressed supercoiled state, the promoter sequence is almost completely inaccessible to the polymerase and the transcription factors. However, among the regions where topoisomerases have untwisted the DNA, the properties of the nucleosome determine whether a gene will be expressed.
\n\nCertain modifications to the histone proteins that compose the nucleosome, such as methylation, acetylation, or lactylation of specific places on the protein can change how tightly bound the DNA is to the histone core. These particular modifications are part of the epigenome, which is used by multicellular organisms to allow for cell differentiation. The epigenome is copied to the newly synthesized DNA strands during cell replication, ensuring that descendants of the differentiated cell will be the same type.
\nSince epigenetic markers like histone modifications affect the accessibility of DNA, in many cases they can serve the determining factor for how much will certain genes be expressed. This competition involves using the frequency and positions of histones in the region of gene promoter sequences in order to predict expression values
", "isPublished": false, "hasIsPublished": false, "postTitle": "", "hasPostTitle": false, "mimeType": "", "hasMimeType": false }, { "name": "Evaluation", "content": "The evaluation of the results will be done by Mean Squared Error (MSE) between the predicted expression values and the results. 25% of the submission will be used for the public score, with the other 75% included for the final evaluation.", "isPublished": false, "hasIsPublished": false, "postTitle": "", "hasPostTitle": false, "mimeType": "", "hasMimeType": false }, { "name": "Prizes", "content": "