Please check the basic kernel Demo MiFID metric for Dog image generation comp by @wendykan
\n\nIn GANs, the objective function for the generator and the discriminator usually measures how well they are doing relative to the opponent. For example, we measure how well the generator is fooling the discriminator. It is not a good metric in measuring the image quality or its diversity. As part of the GAN series, we look into the Inception Score and Fréchet Inception Distance on how to compare results from different GAN models.
\n\nIS uses two criteria in measuring the performance of GAN:
\n\nEntropy can be viewed as randomness. If the value of a random variable x is highly predictable, it has low entropy. On the contrary, if it is highly unpredictable, the entropy is high. For example, in the figure below, we have two probability distributions p(x). p2 has a higher entropy than p1 because p2 has a more uniform distribution and therefore, less predictable about what x is.
\n\n\n\nIn FID, we use the Inception network to extract features from an intermediate layer. Then we model the data distribution for these features using a multivariate Gaussian distribution with mean µ and covariance Σ. The FID between the real images x and generated images g is computed as:
\n\n\n\nwhere Tr sums up all the diagonal elements.
\n\n> Lower FID values mean better image quality and diversity.
\n\nFID is sensitive to mode collapse. As shown below, the distance increases with simulated missing modes.
\n\n\n\nFID is more robust to noise than IS. If the model only generates one image per class, the distance will be high. So FID is a better measurement for image diversity. FID has some rather high bias but low variance. By computing the FID between a training dataset and a testing dataset, we should expect the FID to be zero since both are real images. However, running the test with different batches of training sample shows none zero FID.
\n\n
\n\nAlso, both FID and IS are based on the feature extraction (the presence or the absence of features). Will a generator have the same score if the spatial relationship is not maintained?
\n\nIf the generated images look similar to the real images on average, the precision is high. High recall implies the generator can generate any sample found in the training dataset. A F1 score is the harmonic average of precision and recall.
\n\nIn the Google Brain research paper “Are GANs created equal”, a toy experiment with a dataset of triangles is created to measure the precision and the recall of different GAN models.
\n\n
\n\nSubmissions are evaluated on MiFID (Memorization-informed Fréchet Inception Distance), which is a modification from Fréchet Inception Distance (FID).
\n\nThe smaller MiFID is, the better your generated images are.
\n\nKaggle calculates public and private MiFID scores with the same code, but with different pre-trained models and evaluation images. The public pre-train neural network is Inception, and the public images used for evaluation are the ImageNet Dogs (all 120 breeds). We will not be sharing what private model or dataset is used for the private MiFID score.
\n\nA demo of our MiFID evaluation code can be seen here.
\n\nOur workflow of computing the public/private MiFID is demonstrated below:
\n\nCheck Kaggle Evaluation Workflow
\n\n.png)
I guess we need to find out more about the mysterious NN and private image features
\n\n@jonathan_hui/gan-how-to-measure-gan-performance-64b988c47732\">GAN — How to measure GAN performance?
GANs Trained by a Two Time-Scale Update Rule Converge to a Local Nash Equilibrium
In my kernel here, I further clarify the metric FID by explaining the below diagram. FID approx = ||c2-c1||^2 + (h2-h1)^2 + (w2-w1)^2. FID is the distance squared between two ellipses (Gaussian distributions) in latent space where c_k is the center of the ellipses (means of features) and h_k and w_k are widths of ellipses (standard deviation of features).

How do we measure inception score and FID ? Do we save the images generated by generator during training and later measure the score or do we go parallaly during training ?
", "rawMarkdown": "How do we measure inception score and FID ? Do we save the images generated by generator during training and later measure the score or do we go parallaly during training ?", "replies": [ { "id": 591847, "postDate": "2019-08-04T11:06:19.543Z", "content": "Probably looking up to references might help you out.
", "rawMarkdown": " Probably looking up to references might help you out. ", "votes": 2 } ] }, { "id": 566994, "postDate": "2019-07-02T22:23:44.253Z", "rawMarkdown": "", "isDeleted": true }, { "id": 565209, "postDate": "2019-06-30T15:31:27.360Z", "content": "thanks a lot @jesucristo
", "rawMarkdown": "thanks a lot @jesucristo ", "votes": 1 }, { "id": 591866, "postDate": "2019-08-04T11:50:38.610Z", "content": "Thanks for sharing @jesucristo
", "rawMarkdown": "Thanks for sharing @jesucristo " }, { "id": 564401, "postDate": "2019-06-29T11:18:51.320Z", "content": "Thanks for sharing!
", "rawMarkdown": "Thanks for sharing!" } ], "comments": [ { "id": 566998, "author_name": "Chris Deotte", "author_url": "", "post_date": "2019-07-02T22:39:12.913000", "content": "In my kernel here, I further clarify the metric FID by explaining the below diagram. FID approx = ||c2-c1||^2 + (h2-h1)^2 + (w2-w1)^2. FID is the distance squared between two ellipses (Gaussian distributions) in latent space where c_k is the center of the ellipses (means of features) and h_k and w_k are widths of ellipses (standard deviation of features).
How do we measure inception score and FID ? Do we save the images generated by generator during training and later measure the score or do we go parallaly during training ?
", "votes": 0, "replies": [ { "id": 591847, "author_name": "torch", "author_url": "", "post_date": "2019-08-04T11:06:19.543000", "content": "Probably looking up to references might help you out.
", "votes": 2, "replies": [] } ] }, { "id": 566994, "author_name": "", "author_url": "", "post_date": "2019-07-02T22:23:44.253000", "content": "", "votes": 0, "replies": [] }, { "id": 565209, "author_name": "Firat Gonen", "author_url": "", "post_date": "2019-06-30T15:31:27.360000", "content": "thanks a lot @jesucristo
", "votes": 1, "replies": [] }, { "id": 591866, "author_name": "Karan Jakhar", "author_url": "", "post_date": "2019-08-04T11:50:38.610000", "content": "Thanks for sharing @jesucristo
", "votes": 0, "replies": [] }, { "id": 564401, "author_name": "Shweta Goyal", "author_url": "", "post_date": "2019-06-29T11:18:51.320000", "content": "Thanks for sharing!
", "votes": 0, "replies": [] } ], "raw_markdown_by_id": { "564085": "Please check the basic kernel [Demo MiFID metric for Dog image generation comp](https://www.kaggle.com/wendykan/demo-mifid-metric-for-dog-image-generation-comp/notebook) by @wendykan \n\n\n# How to measure GAN performance?\n\nIn GANs, the objective function for the generator and the discriminator usually measures how well they are doing relative to the opponent. For example, we measure how well the generator is fooling the discriminator. It is not a good metric in measuring the image quality or its diversity. As part of the GAN series, we look into the Inception Score and Fréchet Inception Distance on how to compare results from different GAN models.\n\n## Inception Score (IS)\n\nIS uses two criteria in measuring the performance of GAN:\n\n- The quality of the generated images, and\n- **their diversity.**\n\nEntropy can be viewed as randomness. If the value of a random variable x is highly predictable, it has low entropy. On the contrary, if it is highly unpredictable, the entropy is high. For example, in the figure below, we have two probability distributions p(x). p2 has a higher entropy than p1 because p2 has a more uniform distribution and therefore, less predictable about what x is.\n\n\n\n## Fréchet Inception Distance (FID)\n\nIn FID, we use the Inception network to extract features from an intermediate layer. Then we model the data distribution for these features using a multivariate Gaussian distribution with mean µ and covariance Σ. The FID between the real images x and generated images g is computed as:\n\n\n\nwhere Tr sums up all the diagonal elements.\n\n> Lower FID values mean better image quality and diversity.\n\nFID is sensitive to mode collapse. As shown below, the distance increases with simulated missing modes.\n\n\n\nFID is more robust to noise than IS. If the model only generates one image per class, the distance will be high. So FID is a better measurement for image diversity. FID has some rather high bias but low variance. By computing the FID between a training dataset and a testing dataset, we should expect the FID to be zero since both are real images. However, running the test with different batches of training sample shows none zero FID.\n\n\n\nAlso, both FID and IS are based on the **feature extraction** (the presence or the absence of features). Will a generator have the same score if the spatial relationship is not maintained?\n\n## Precision, Recall and F1 Score\n\nIf the generated images look similar to the real images on average, the precision is high. High recall implies the generator can generate any sample found in the training dataset. A F1 score is the harmonic average of precision and recall.\n\nIn the Google Brain research paper “Are GANs created equal”, a toy experiment with a dataset of triangles is created to measure the precision and the recall of different GAN models.\n\n\n\n## Kaggle Evaluation (MiFID)\n\nSubmissions are evaluated on MiFID (Memorization-informed Fréchet Inception Distance), which is a modification from Fréchet Inception Distance (FID).\n\nThe smaller MiFID is, the better your generated images are.\n\nKaggle calculates public and private MiFID scores with the same code, but with different pre-trained models and evaluation images. The public pre-train neural network is Inception, and the public images used for evaluation are the ImageNet Dogs (all 120 breeds). We will not be sharing what private model or dataset is used for the private MiFID score.\n\nA demo of our **MiFID** evaluation code can be seen here.\n\nOur workflow of computing the public/private MiFID is demonstrated below:\n\n**Check [Kaggle Evaluation Workflow](https://www.kaggle.com/c/generative-dog-images/overview/evaluation)**\n\n\n\nI guess we need to find out more about the **mysterious NN** and **private image features**\n\n## References\n- [GAN — How to measure GAN performance?](https://medium.com/@jonathan_hui/gan-how-to-measure-gan-performance-64b988c47732)\n\n- [Improved Techniques for Training GANs](https://arxiv.org/pdf/1606.03498.pdf)\n\n- [Are GANs Created Equal? A Large-Scale Study](https://arxiv.org/pdf/1711.10337.pdf)\n\n- [GANs Trained by a Two Time-Scale Update Rule Converge to a Local Nash Equilibrium](https://arxiv.org/pdf/1706.08500.pdf)", "566998": "In my kernel [here][1], I further clarify the metric FID by explaining the below diagram. `FID approx = ||c2-c1||^2 + (h2-h1)^2 + (w2-w1)^2`. FID is the distance squared between two ellipses (Gaussian distributions) in latent space where `c_k` is the center of the ellipses (means of features) and `h_k` and `w_k` are widths of ellipses (standard deviation of features).\n\n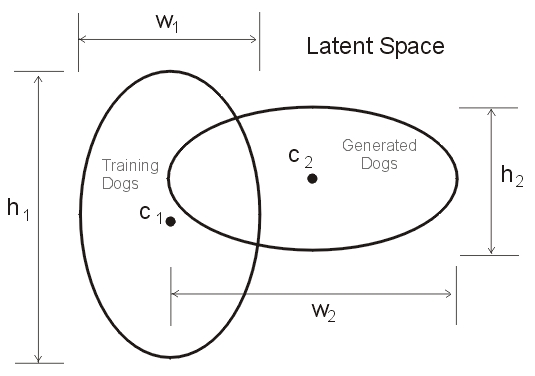\n\n[1]: https://www.kaggle.com/cdeotte/dog-autoencoder#How-is-LB-scored?", "584572": "How do we measure inception score and FID ? Do we save the images generated by generator during training and later measure the score or do we go parallaly during training ?", "566994": "", "565209": "thanks a lot @jesucristo ", "591866": "Thanks for sharing @jesucristo ", "564401": "Thanks for sharing!" } }